Claude Code Token Usage Audit: Context, Cache, MCP, and Session Costs
Do not explain a fast-draining Claude Code session from one total. Prove the billing route, inspect the context and cache classes, attribute MCP and agent usage, then compare a clean control session.
On this page
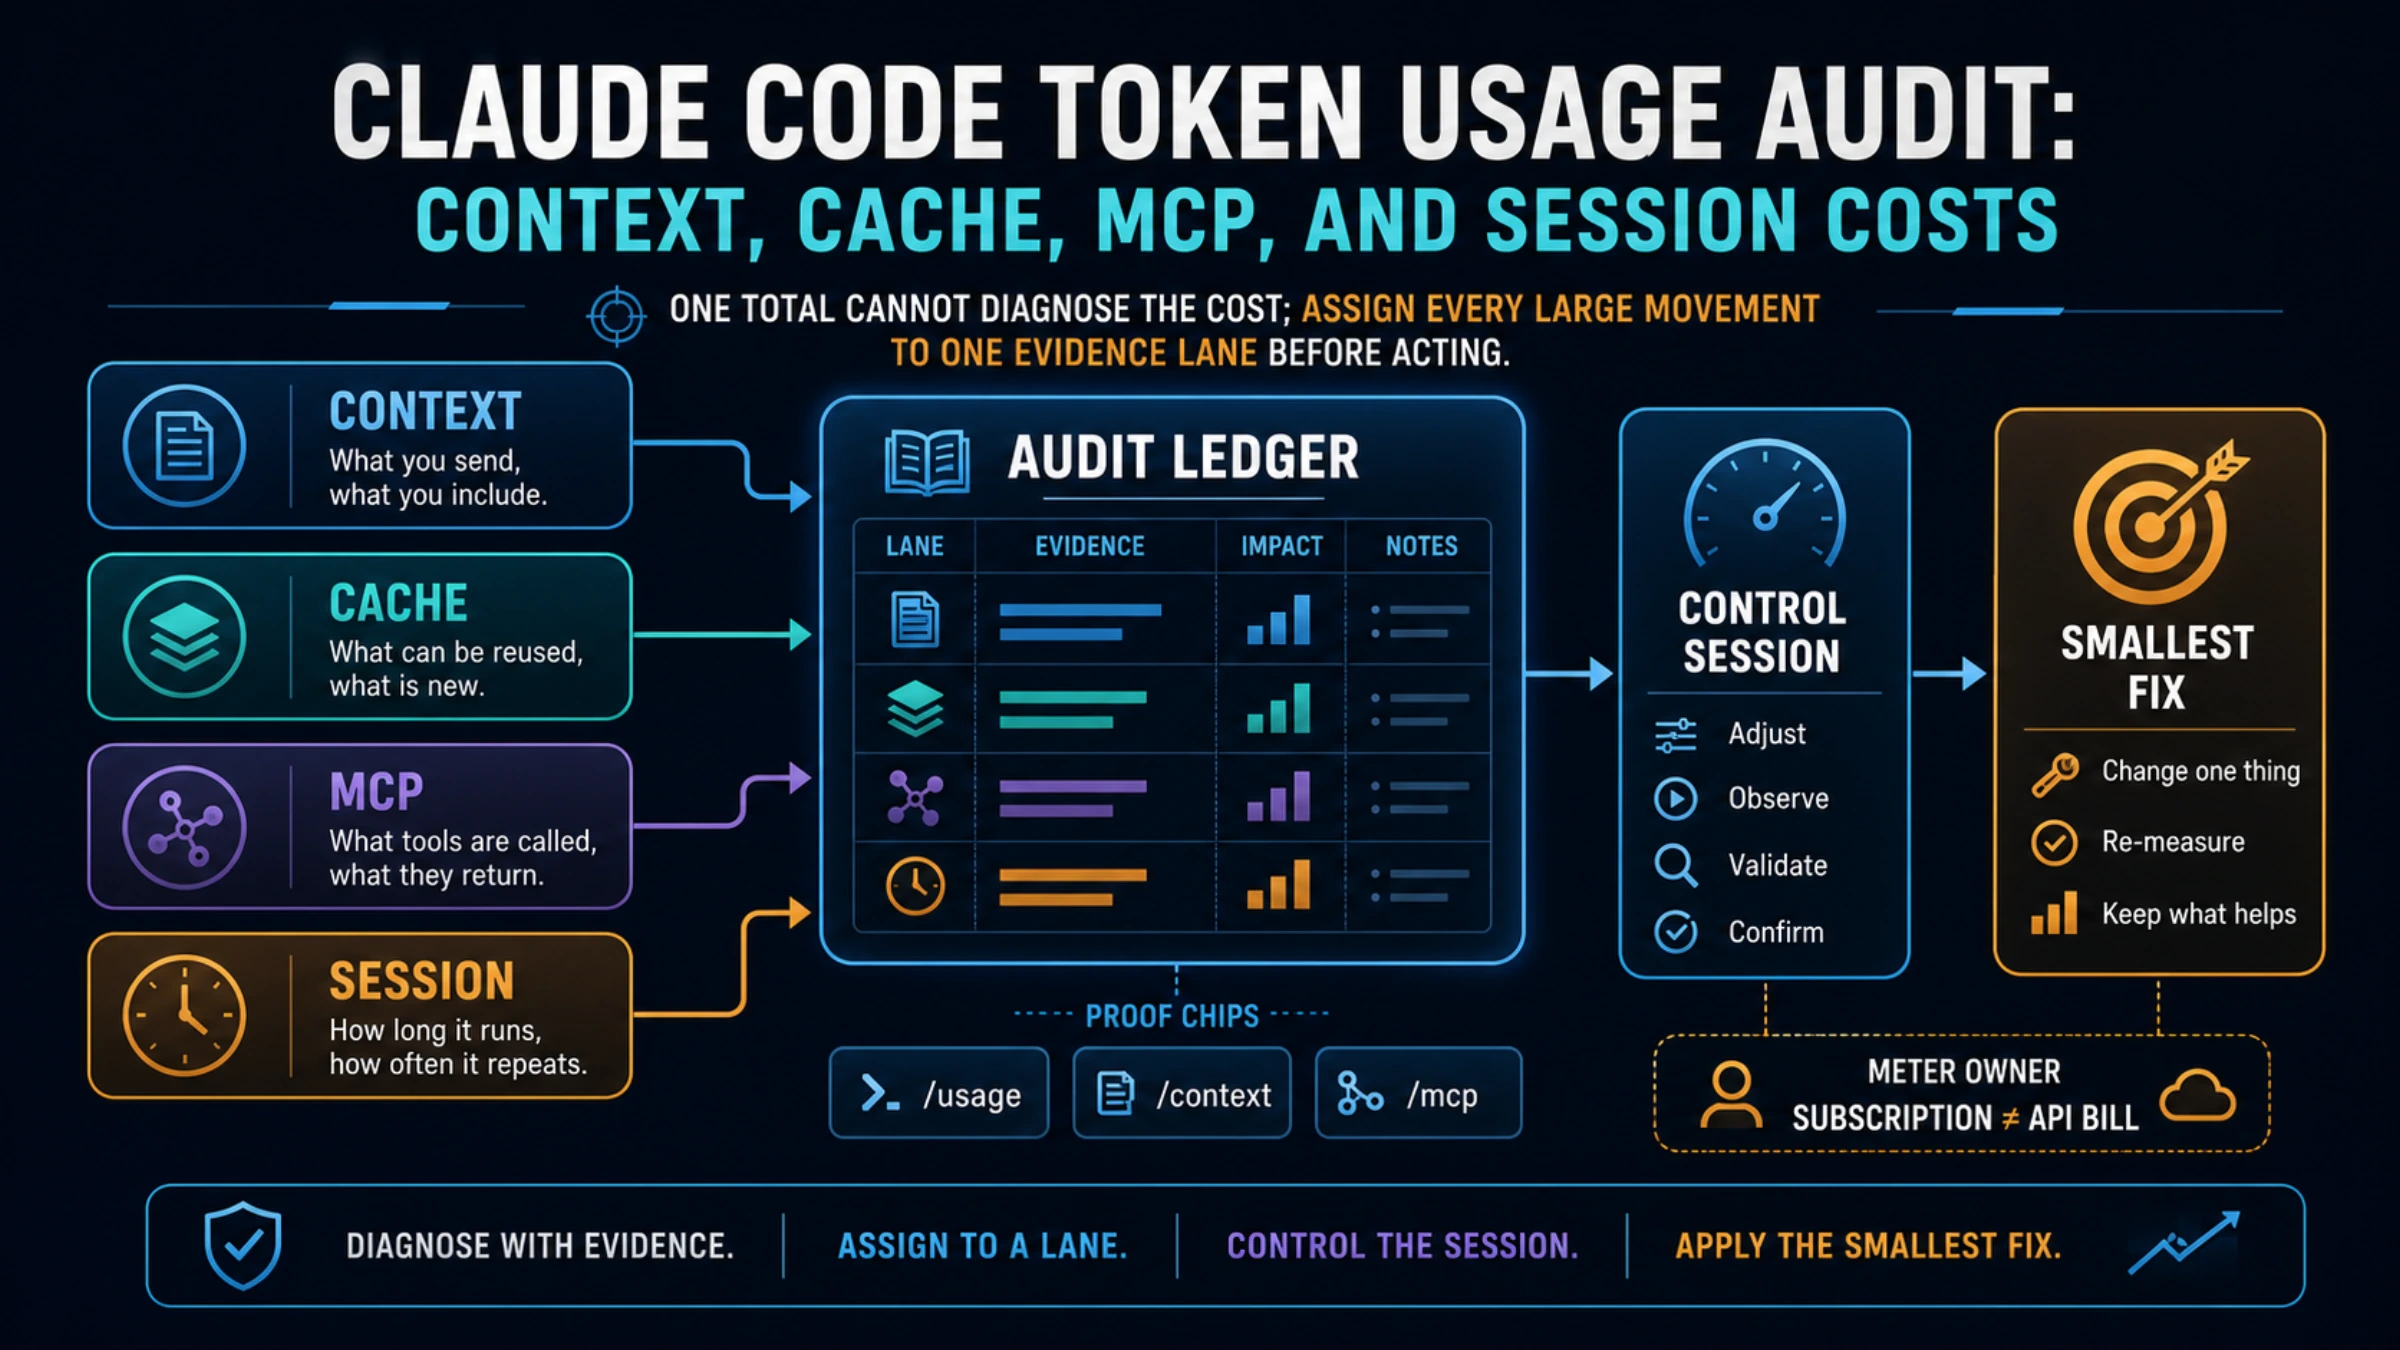
A useful Claude Code token audit starts with ownership, not optimization. A subscription usage bar, a locally estimated session cost, a Claude Console invoice, and a cloud-provider bill are different meters. If you mix them, even accurate token counts lead to the wrong conclusion.
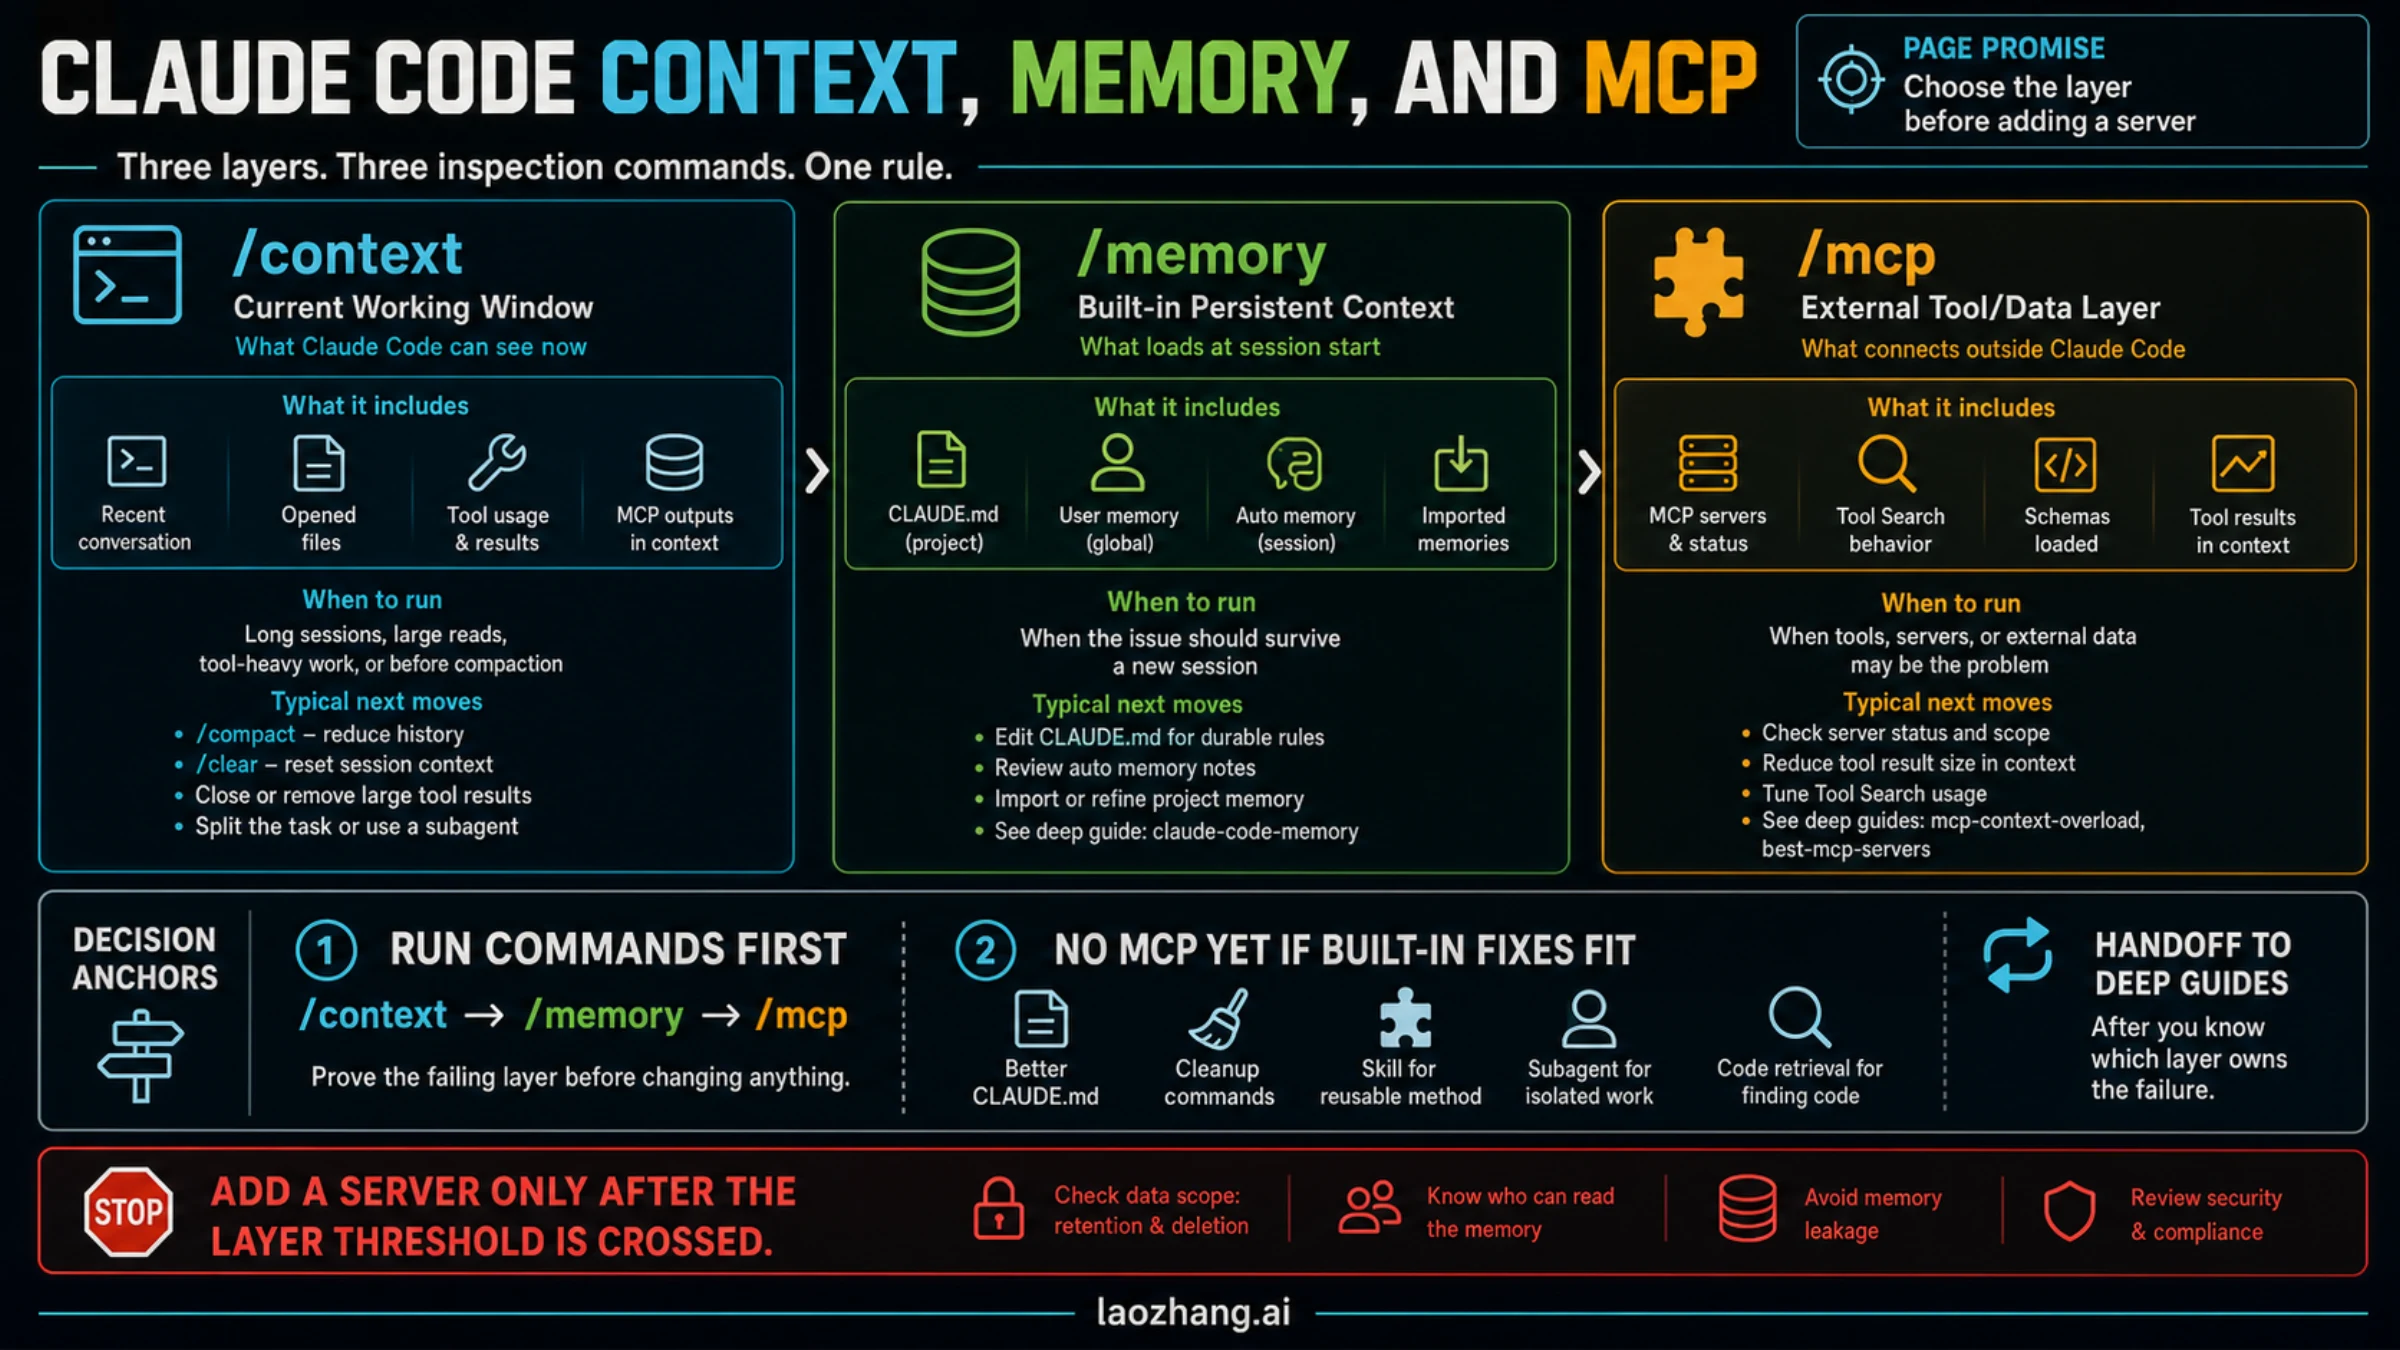
Keep the suspect session open. Record claude --version, then run /usage, /context, and /mcp. Capture the active model and effort, authentication route, session ID, context percentage, input and output tokens, cache creation and cache reads, plan bars or API estimate, and any exact limit or error message. That small ledger is enough to separate most ordinary heavy sessions from repeatable anomalies.
Anthropic's current cost documentation, context guide, prompt-caching guide, and MCP documentation were checked on August 4, 2026. Claude Code changes quickly, so use your installed version when a field or menu differs.
Identify the meter before interpreting the number
The Session block in /usage reports the current session's token activity. Its dollar value is computed locally at standard list rates. It is useful for comparing sessions, but it may not match promotional pricing, contracted discounts, or the final provider bill. Pro and Max users have usage included in their subscription, so a local dollar estimate is not evidence of an extra charge.
| What you are looking at | What it can prove | What it cannot prove |
|---|---|---|
/usage plan bars | Local view of subscription usage and recent attribution | Exact API invoice or activity from every device |
/usage Session block | Token mix and local cost estimate for this session | Final billed amount |
/context | What currently occupies the context window | Which provider charged for it |
| Status line | Continuous context and estimated session telemetry | Authoritative billing |
| Claude Console | API workspace usage and spend | Subscription allowance consumption |
| Bedrock, Google Cloud, or Foundry bill | Spend owned by that cloud route | Claude subscription usage |
If the route is unclear, stop the cost calculation. Check the active login, relevant environment variables, base URL, and provider. The Claude Code API key versus subscription billing guide covers that ownership decision in depth.
Build one audit ledger while the evidence is fresh
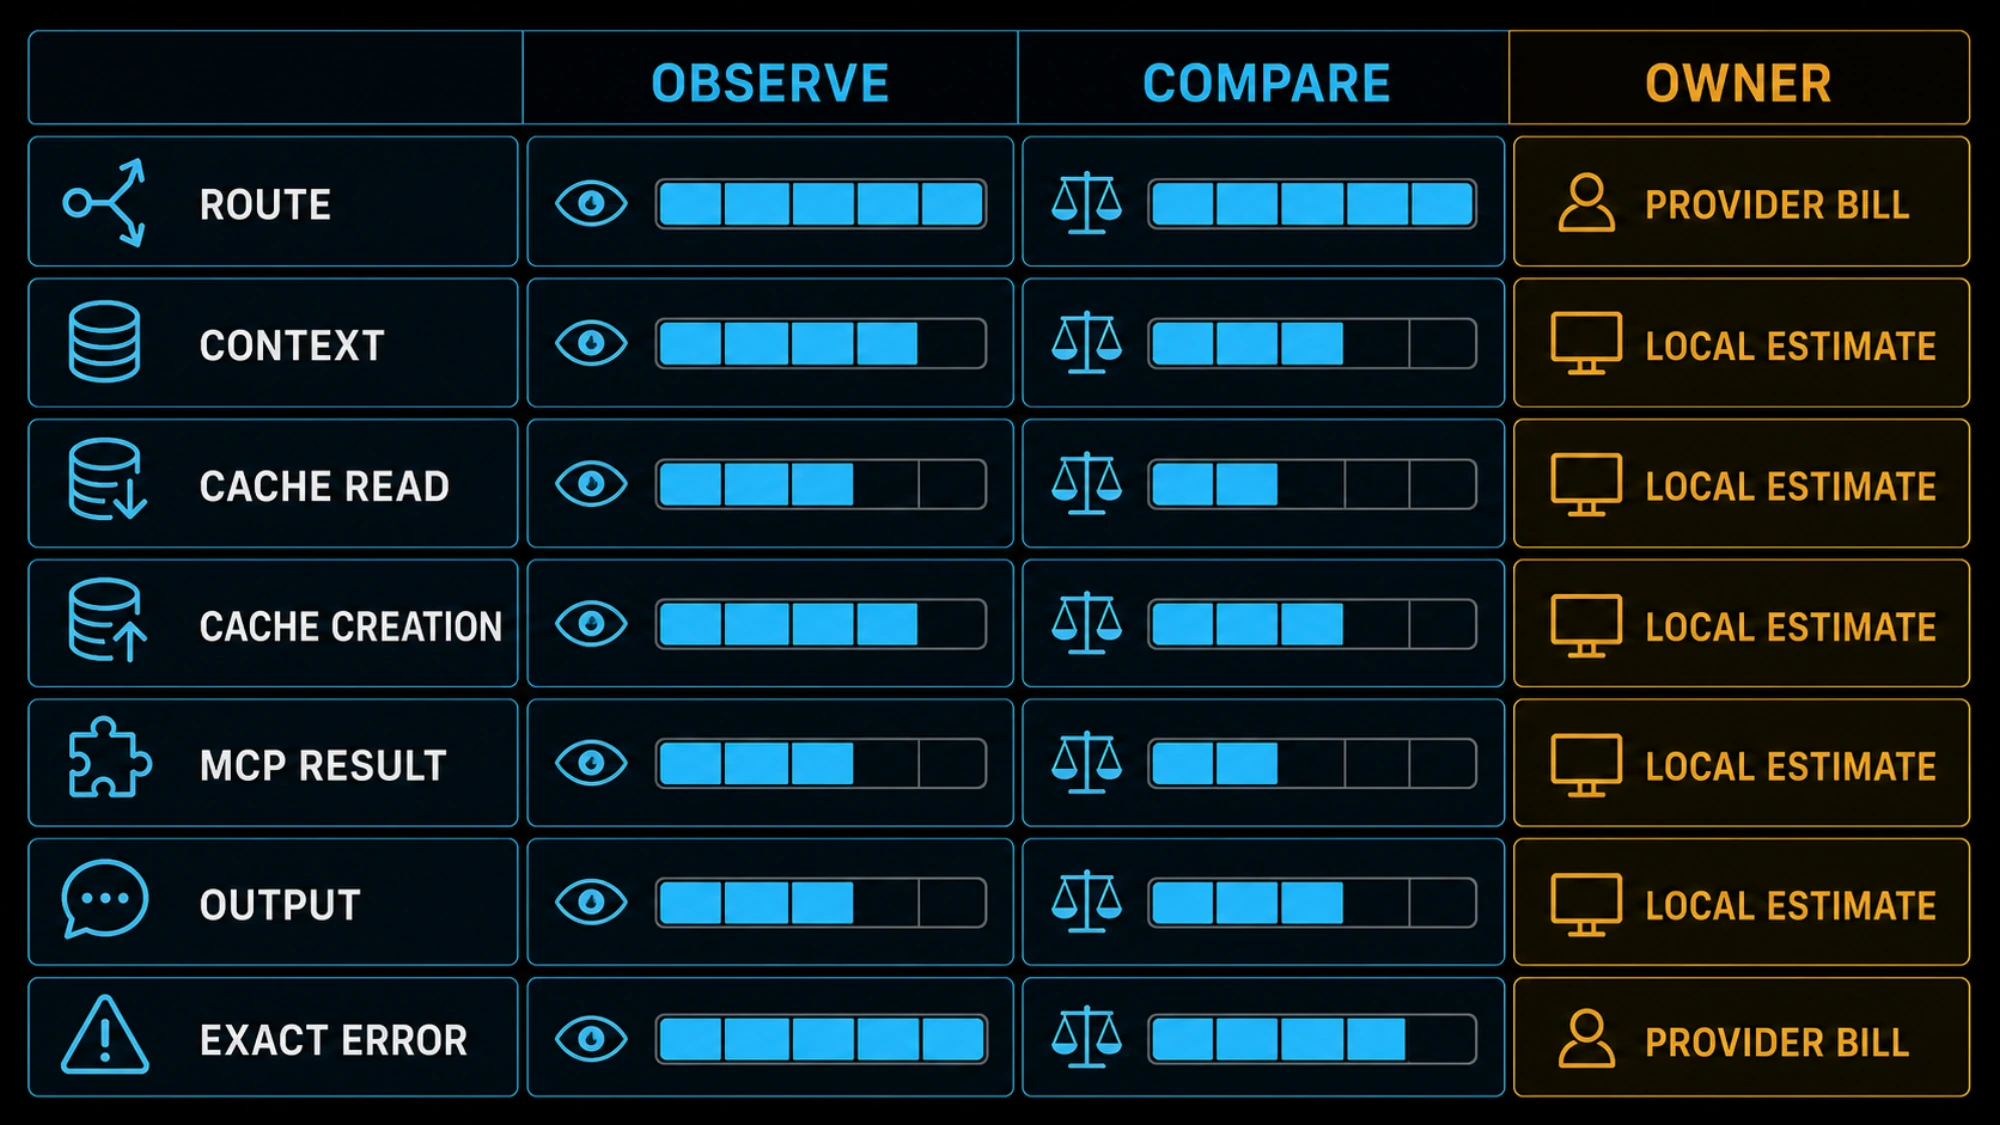
Copy the following fields into a private note. Do not paste API keys, customer code, private prompts, or full transcripts into a support ticket.
| Field | Why it matters | Strong comparison |
|---|---|---|
| Timestamp and timezone | Aligns local telemetry with provider records | Same five-minute interval |
| Claude Code version | Releases can change reporting and prompt shape | Before and after an upgrade |
| Route | Separates subscription, API, cloud, and gateway contracts | Same route in both sessions |
| Model and effort | Both affect usage; switching can rebuild cache | Same model and effort |
| Session ID and working directory | Distinguishes separate histories and cache scopes | Same project, clean new session |
| Context percentage and category breakdown | Shows how much history, files, instructions, and tools are carried | /context before and after the task |
| Input, output, cache creation, cache read | Separates new work from reused prefix | Similar consecutive turns |
| MCP attribution and tool output size | Finds a server or result that dominates recent usage | Same task with only required servers |
| Exact error or limit wording | Separates context warnings, plan windows, 429, and 529 | Unedited text plus timestamp |
Current /usage can attribute recent subscription usage to skills, subagents, plugins, and individual MCP servers. It can also flag material long-context or cache-miss behavior. Treat that as a local diagnostic: it is based on session history on this machine and does not include every other device or Claude surface.
Separate context growth from cache churn
Context and cache are related, but they are not the same meter. Claude Code sends the current conversation, instructions, files, and tool results with each request. As a session grows, the amount of context carried forward can rise even when prompt caching works perfectly.
Run /context and look for the largest categories. Startup context can include CLAUDE.md, memory, MCP tool names, and skill descriptions. File reads, tool results, and conversation messages accumulate as work continues. A long session spanning unrelated tasks therefore costs more per turn than a clean session focused on one outcome.
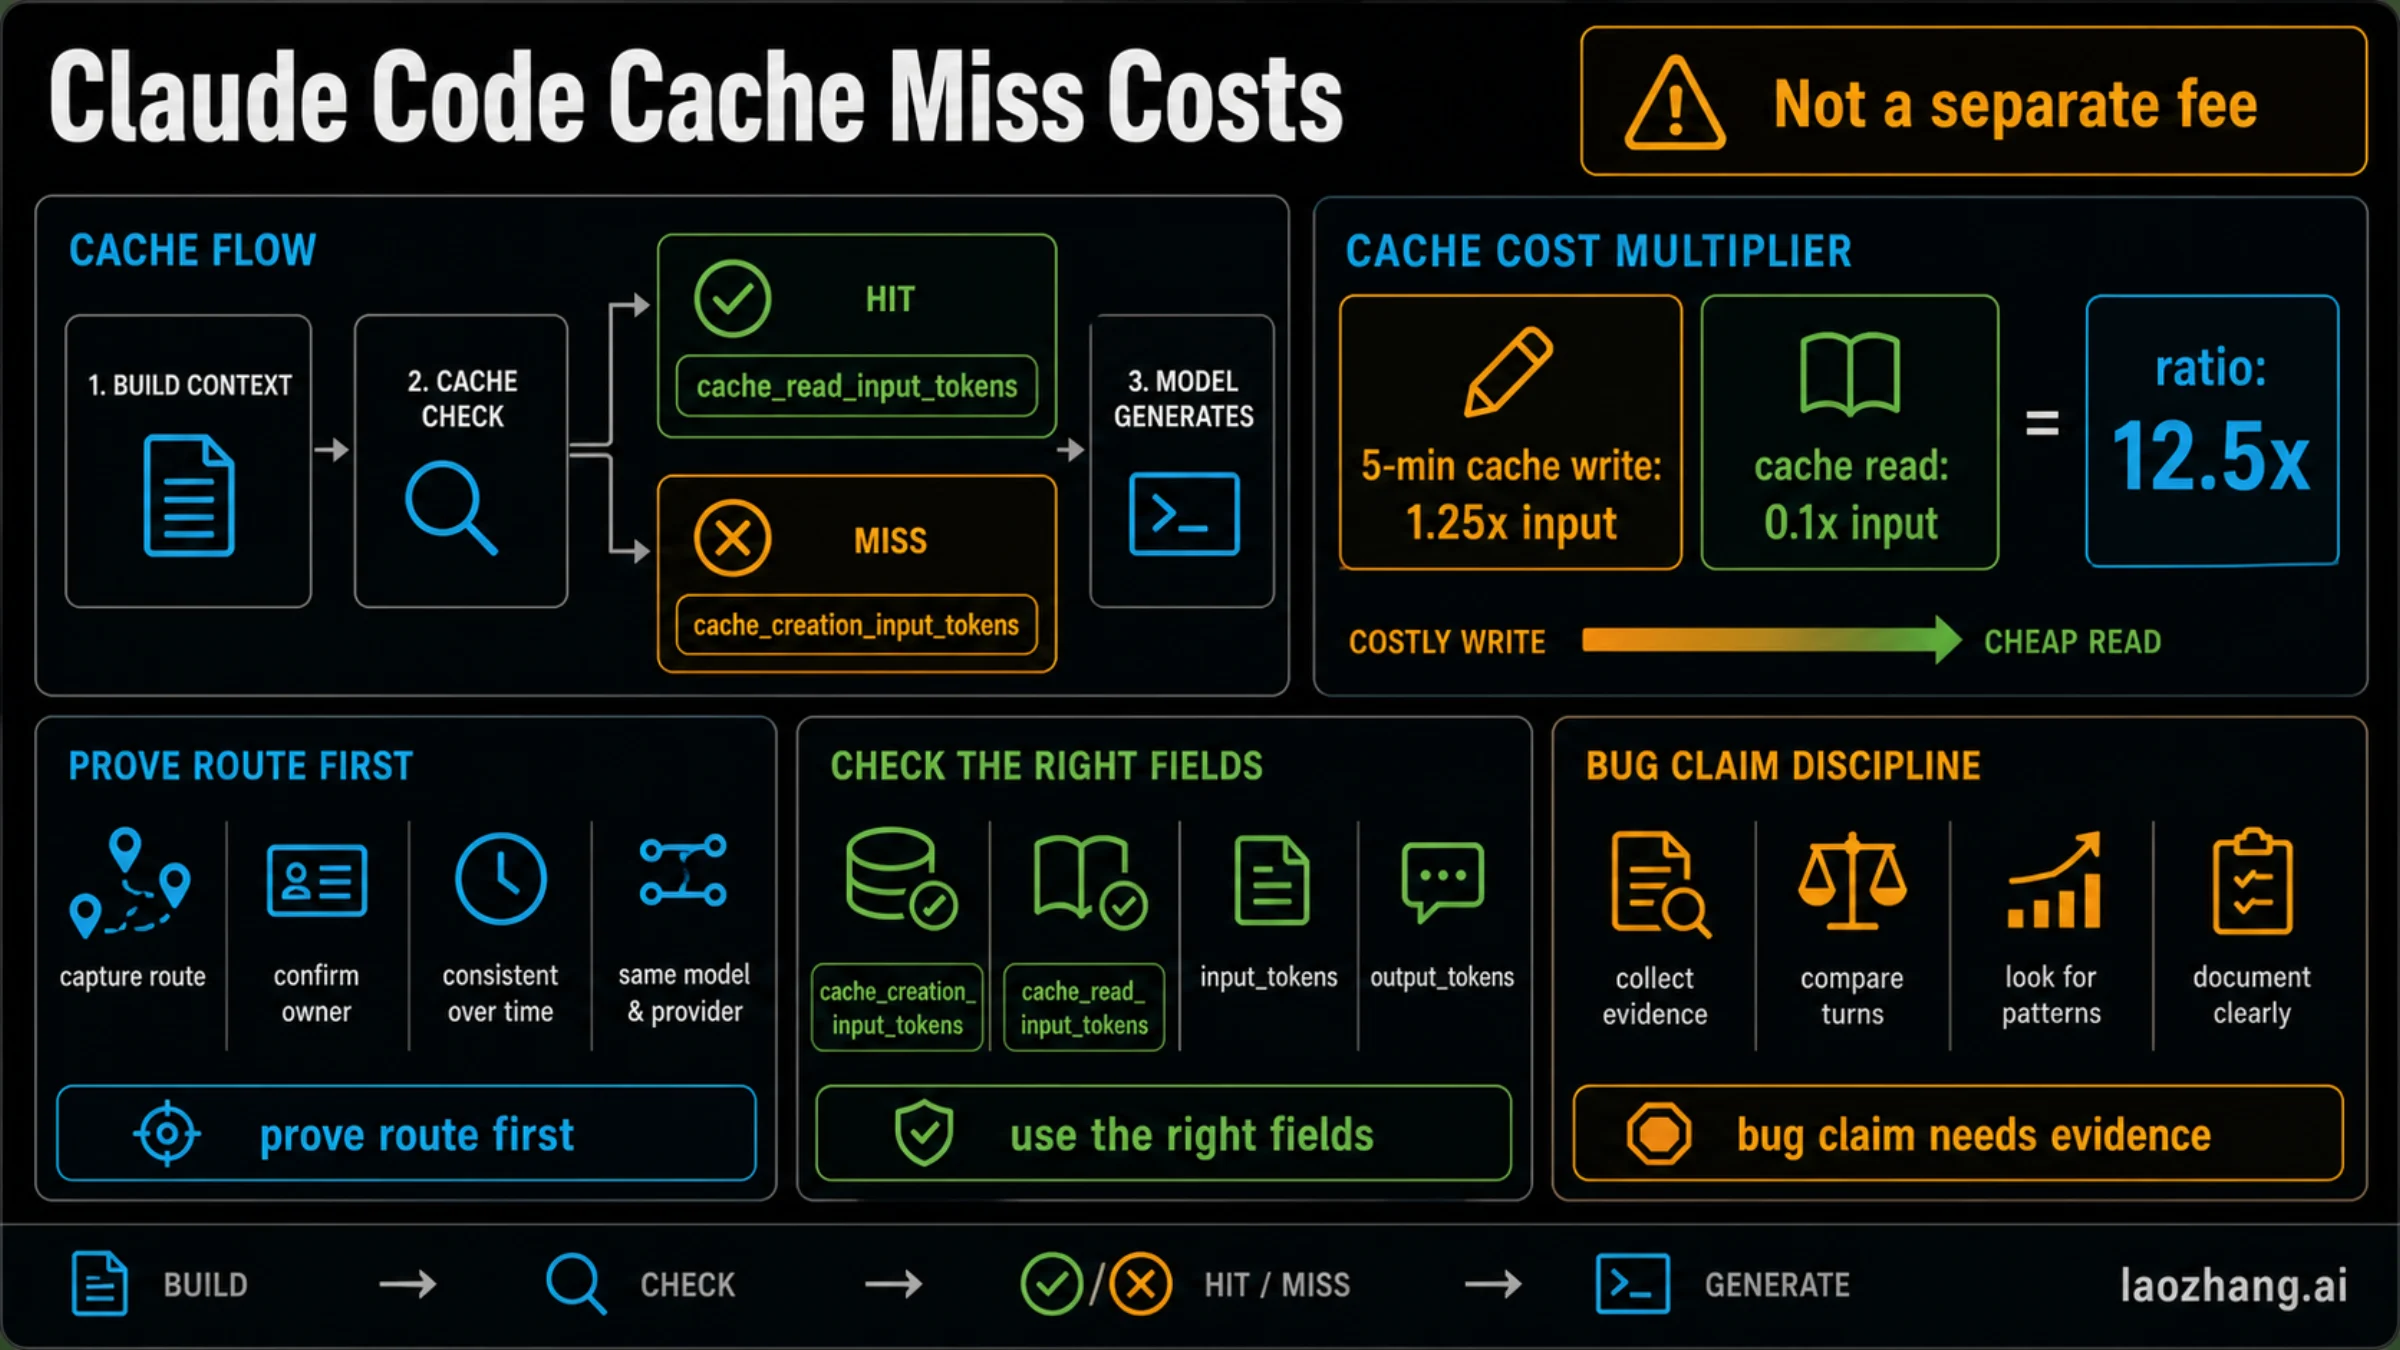
Caching reduces the price of an unchanged prefix. It does not remove the context from the request. Read the token classes separately:
cache_read_input_tokensmeans an existing prefix was reused at the cache-read rate.cache_creation_input_tokensmeans a prefix was written or rebuilt.- normal input covers content that was not served from the cheap read path.
- output remains generated work and is not made free by prompt caching.
One cache write after a model switch, effort change, MCP definition change, /compact, upgrade, route change, or idle expiry can be normal. Repeated high creation with low reads across similar turns is the stronger signal. For TTL and invalidator details, use the Claude Code cache-miss cost guide.
Audit MCP in two separate layers
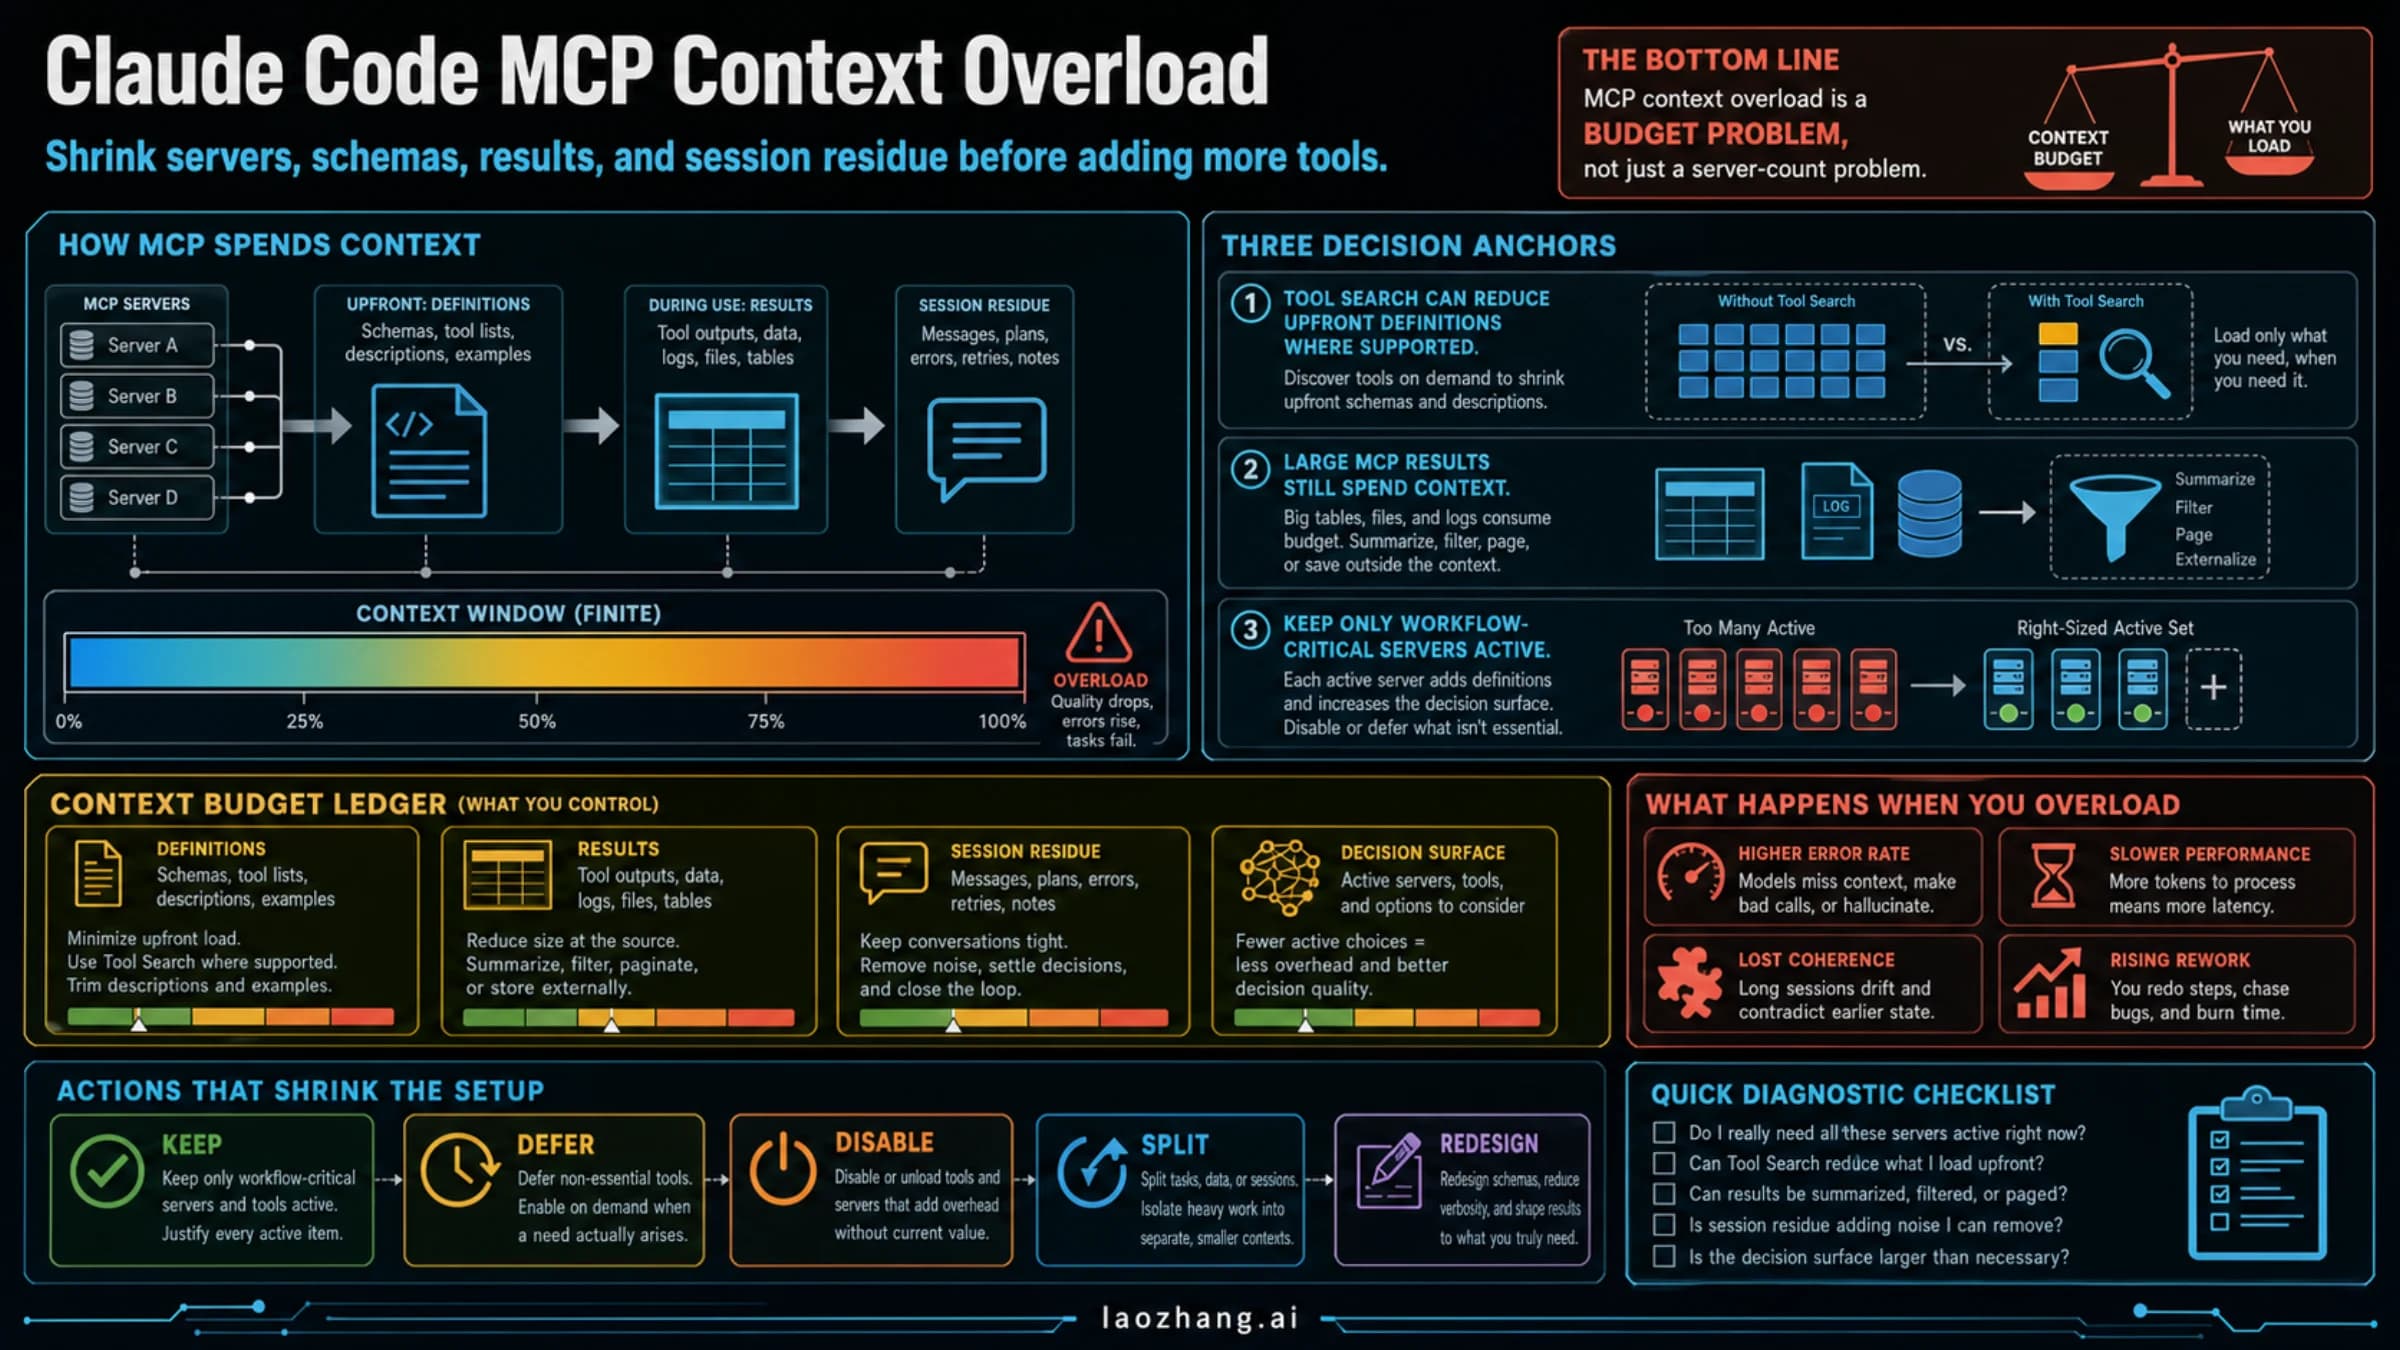
Do not multiply “number of connected servers” by a guessed token cost. Modern Claude Code defers MCP schemas with tool search on supported routes, so only tool names and server instructions load initially and relevant tools are discovered on demand. A provider, gateway, model, setting, or alwaysLoad configuration can change that behavior.
MCP still creates two audit targets:
- Definitions and discovery. Use
/mcpand/contextto see what is active and whether tools are loaded upfront or deferred. - Returned data. A compact tool definition can still produce a huge database dump or log response that stays in conversation history.
Claude Code warns when one MCP result exceeds 10,000 tokens and defaults to a 25,000-token maximum. Raising that limit does not make the result cheaper. Filter, paginate, summarize, or return a handle instead. The MCP context overload guide provides the deeper cleanup path.
Run a clean control session
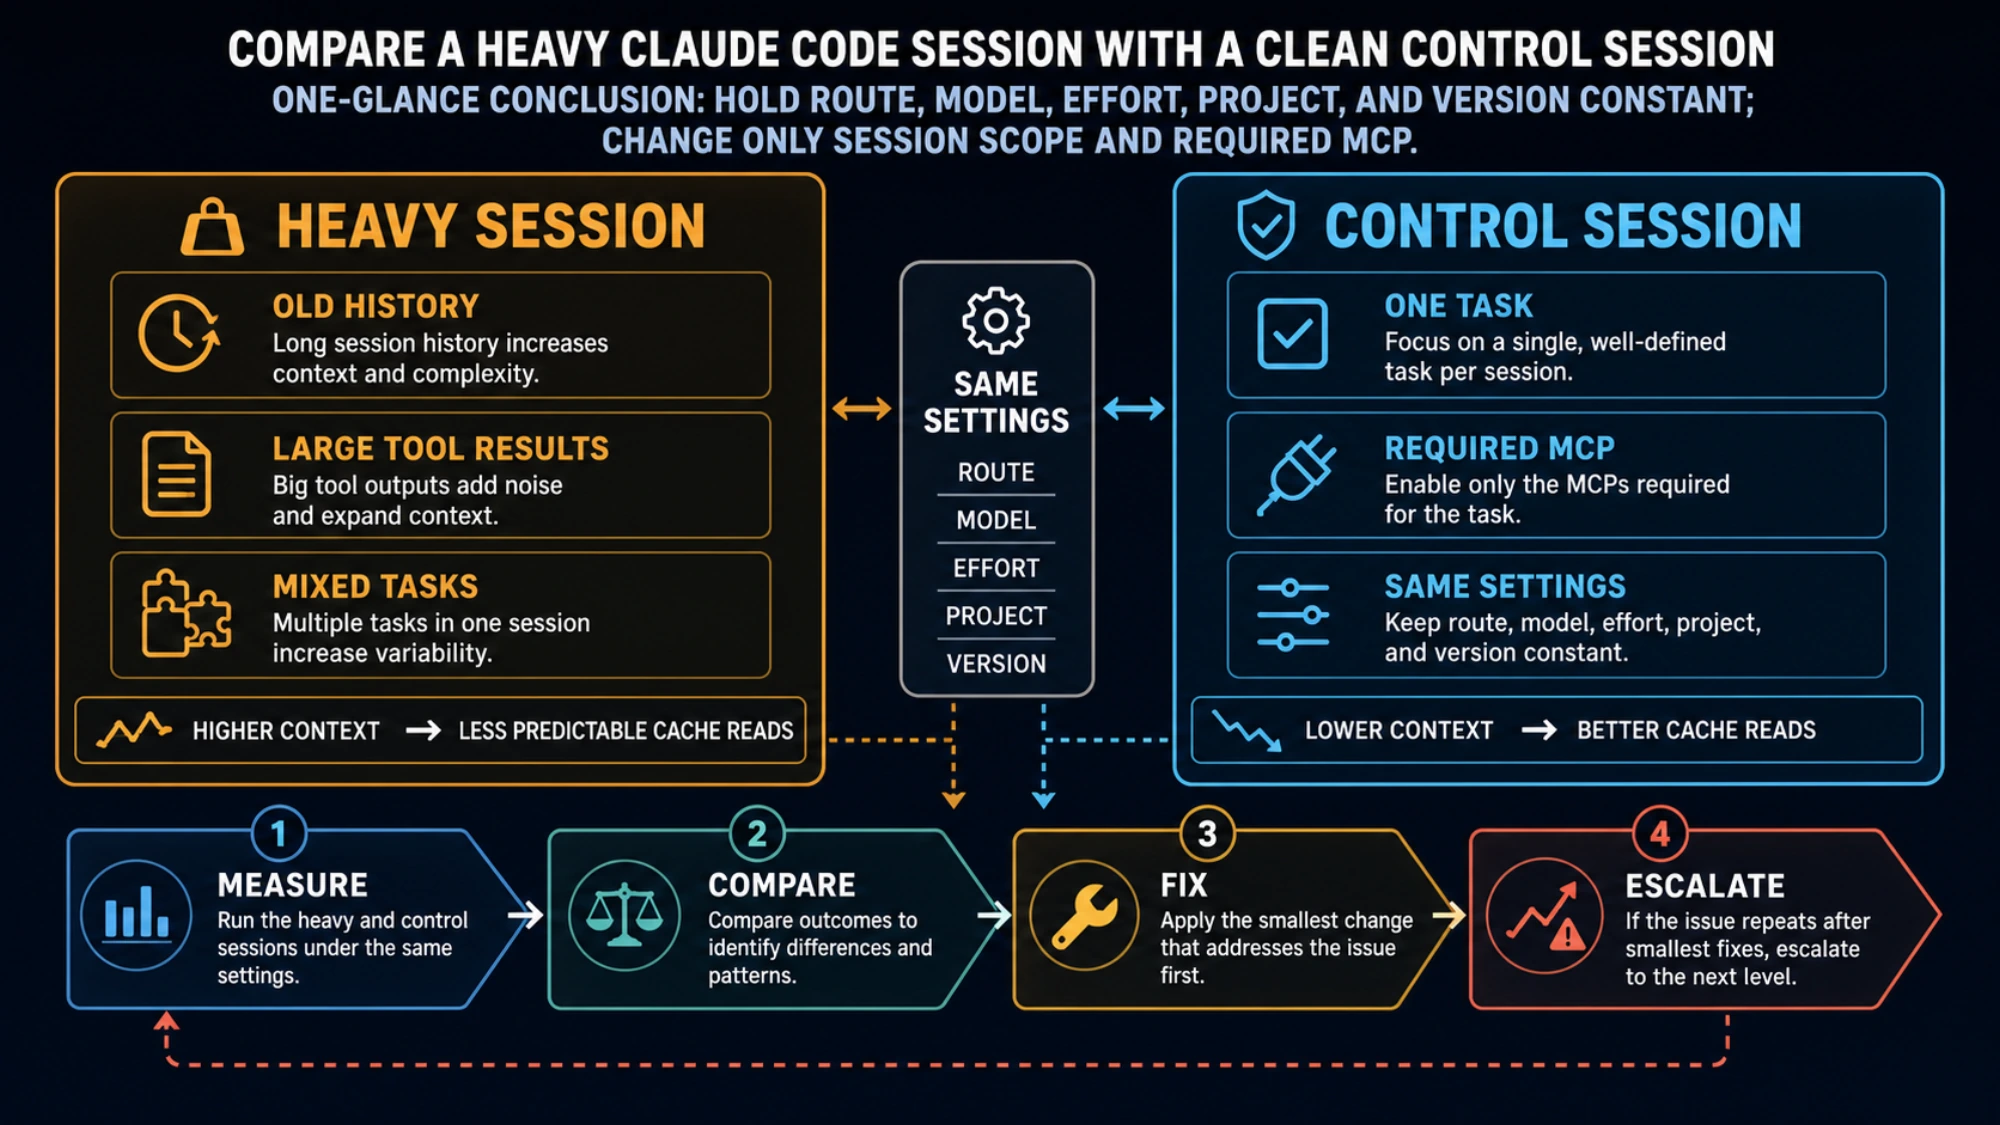
A control session turns a feeling into a comparison. Pick one small task that resembles the expensive work without exposing sensitive data.
- Keep the same route, model, effort, project, and Claude Code version.
- Start a new session and enable only the MCP servers the task actually needs.
- Record
/usageand/contextbefore work. - Run one bounded task with a clear completion condition.
- Record the same fields afterward.
- Compare context growth, cache creation/read, output, MCP attribution, and elapsed API time.
If the control is cheap, the original session was probably carrying history, large tool results, unrelated work, or multiple agent contexts. Use /clear between unrelated tasks, /compact at a natural boundary, narrower tool queries, and a cheaper model or effort for routine work.
If the control reproduces the spike with the same route and settings, preserve the ledger. Do not keep repeating it until you burn more allowance. A strong escalation says: same version, route, model, effort, project, and small task; fresh session; no MCP change; timestamps and token classes attached; disproportionate result reproduced once.
Choose the smallest fix that matches the cause
| Evidence pattern | First fix | Wrong first move |
|---|---|---|
| Context grows across unrelated work | Start a scoped session; clear at the task boundary | Buy a larger plan before testing |
| Cache creation stays high | Stabilize model, effort, tool set, and route; verify the next turn | Compact after every turn |
| One MCP server dominates | Narrow its query or output; defer or disable it for this task | Disable every integration permanently |
| Output tokens dominate | Request a tighter artifact; use a cheaper model when suitable | Blame prompt caching |
| Parallel agents dominate | Reduce team size and give focused spawn prompts | Treat child contexts as free |
Exact 529 | Check service status and retry the same path with bounded backoff | Interpret it as personal quota |
Exact API/provider 429 | Respect retry timing and provider limits | Assume the subscription is exhausted |
| Fresh control still spikes | Escalate with the private ledger | Purchase headroom to hide the symptom |
The audit is complete when every large movement has an owner: context carried, cache written or read, MCP definition or result, output generation, parallel agent, plan window, or billed route. You do not need a perfect universal token model. You need a comparison strong enough to choose one safe next action.