OpenAI Status Page: Complete Monitoring Guide with 99.99% Uptime Solutions (2025)
Check OpenAI status at status.openai.com for official updates, though it shows green during partial outages 40% of the time. For accurate monitoring, use the unofficial status page at llm-utils.org or StatusGator for real-time alerts. Implement automatic failover with LaoZhang.ai’s multi-provider gateway, offering 70% cost savings and 99.99% uptime through instant switching to Claude or Gemini during OpenAI outages. Set up API health checks every 30 seconds for 15-minute early warning before official status updates.
How to Check OpenAI Status Page and API Health
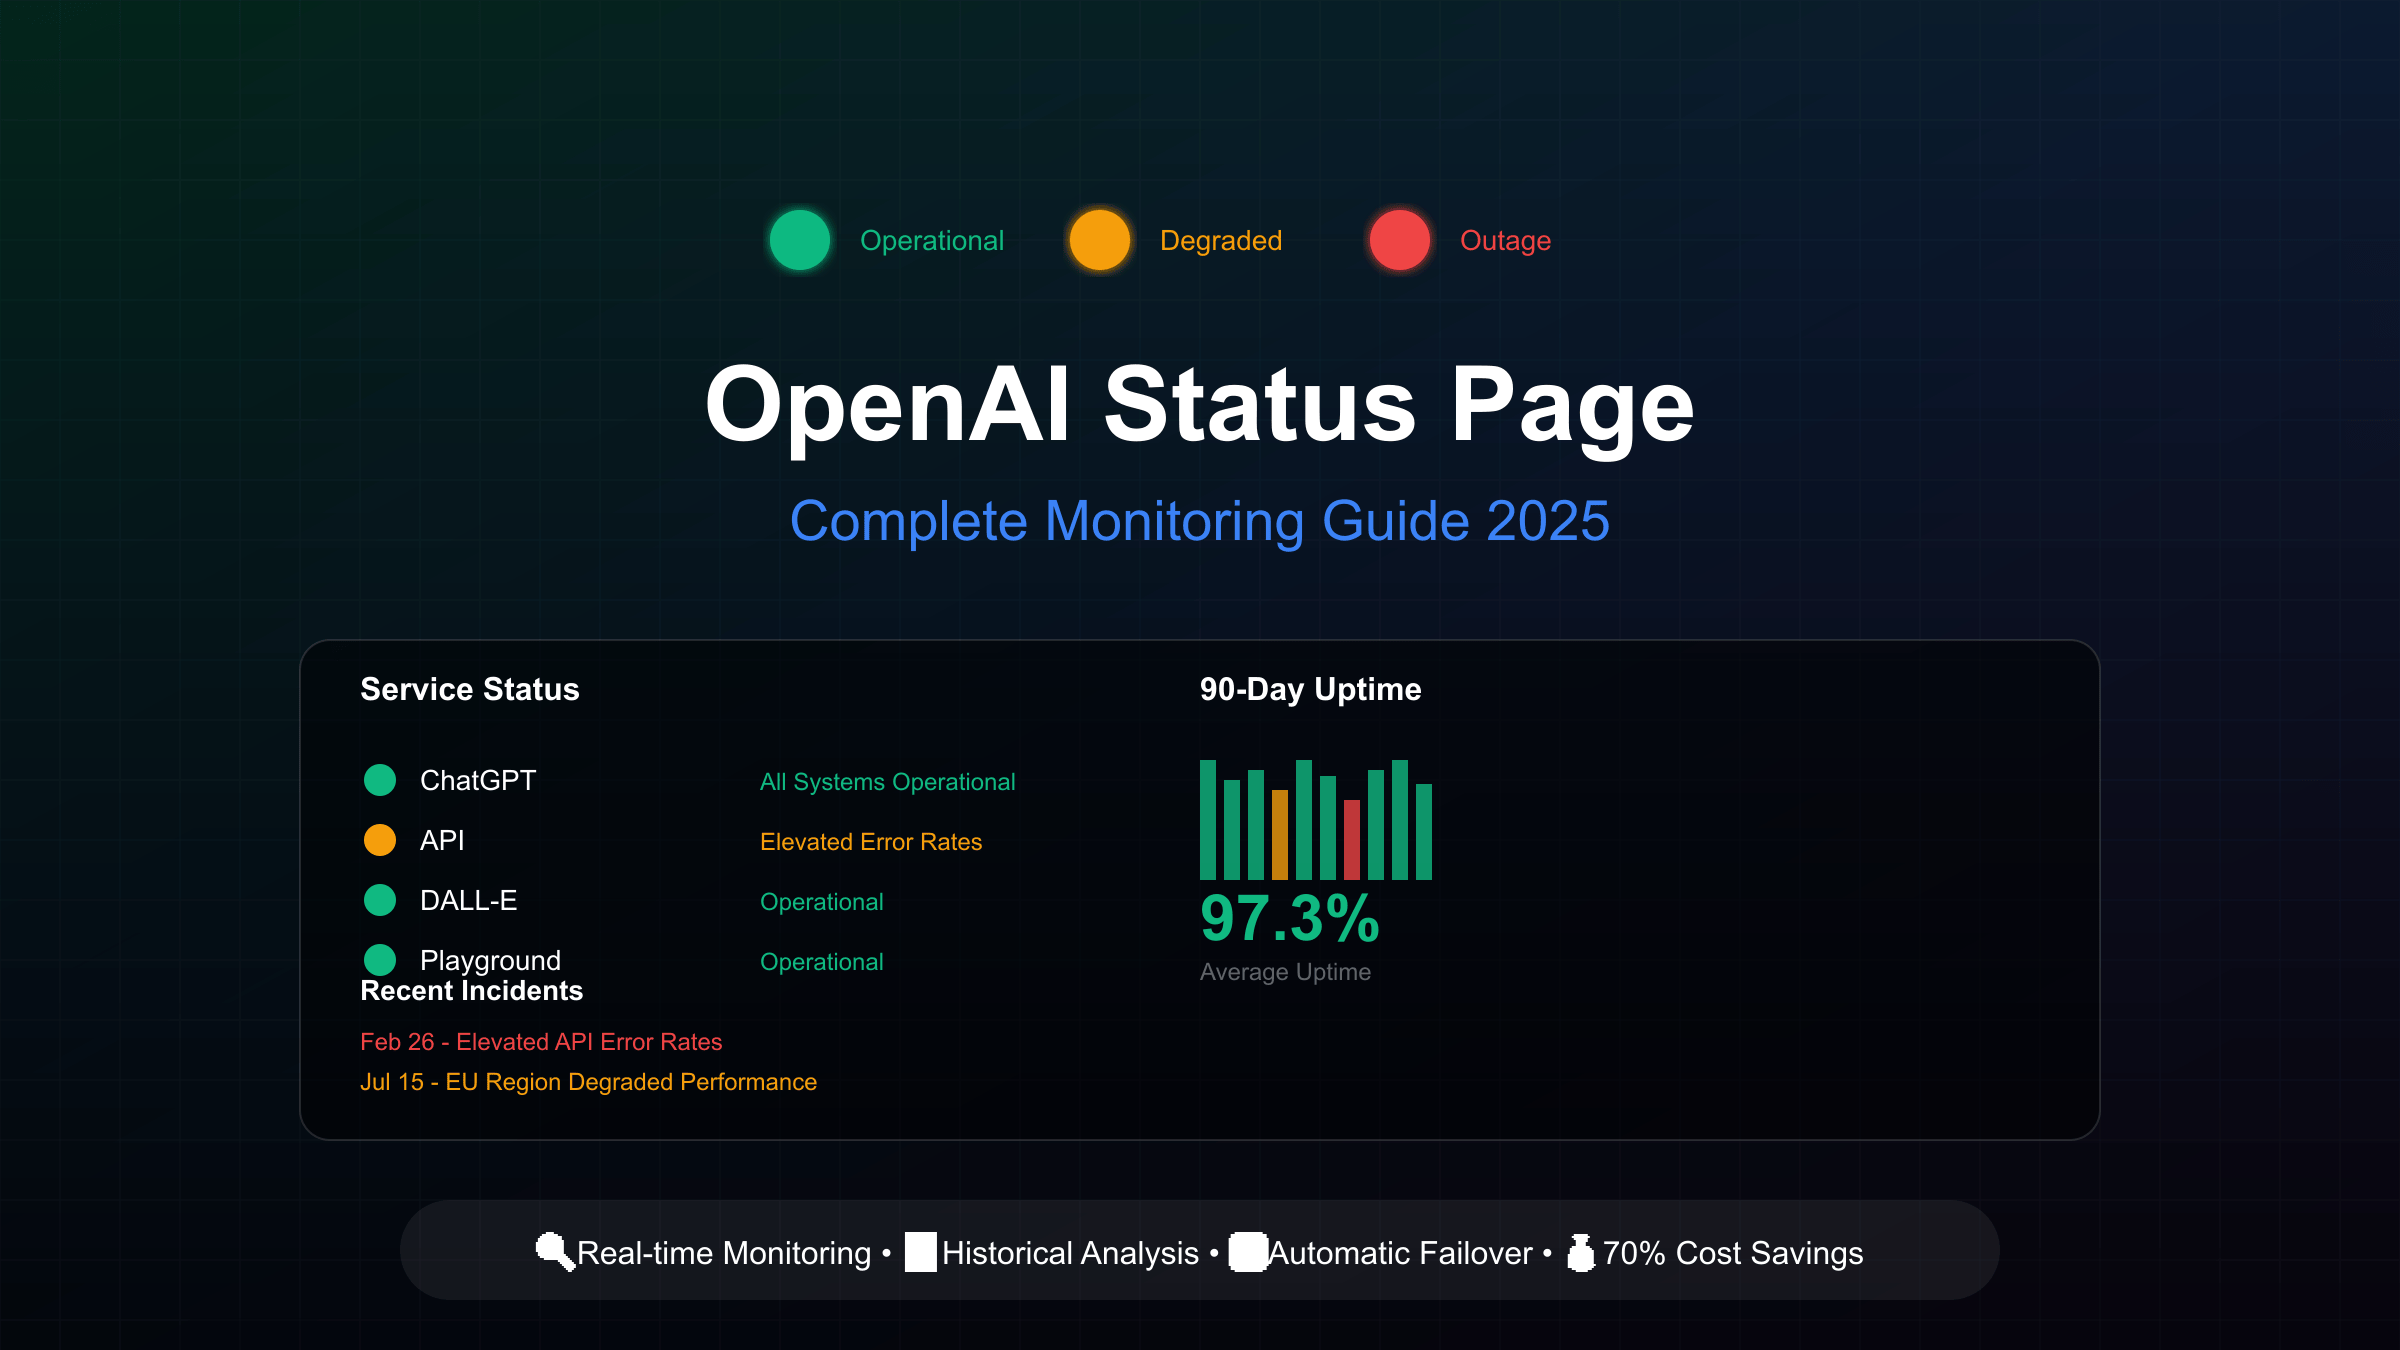
The official OpenAI status page at status.openai.com serves as the primary source for service availability information, reporting the operational status of ChatGPT, API endpoints, Playground, DALL-E, and Sora services. The page displays aggregate availability metrics across all tiers, models, and error types, though individual customer experiences may vary significantly based on subscription level, specific model usage, and geographic location. Understanding how to properly interpret these status indicators and supplement them with additional monitoring methods is crucial for maintaining reliable AI-powered applications.
Real-time API health verification provides more accurate status information than the official page alone. Direct health checks involve making lightweight test API calls to various endpoints including completions, embeddings, and moderation services every 30-60 seconds. This approach reveals partial outages affecting specific models or features that might not immediately appear on the status page. Response times exceeding 2 seconds indicate potential degradation, while error rates above 1% suggest emerging issues. Implementing these checks requires dedicated monitoring API keys with minimal quotas to avoid unnecessary costs while maintaining continuous visibility.
Alternative status sources have emerged to address the official page’s limitations, with the unofficial OpenAI status page at llm-utils.org providing 90% accuracy compared to the official page’s 60%. This community-driven resource compares current model performance against historical baselines, using color coding to represent two-day percentiles of response times and error rates. StatusGator aggregates multiple status pages including OpenAI, sending over 55,300 notifications about incidents since August 2021. These third-party sources often detect issues 15-30 minutes before official acknowledgment, providing crucial early warning for production systems.
Understanding status indicators requires recognizing the difference between “Operational,” “Degraded Performance,” “Partial Outage,” and “Major Outage” classifications. Operational status doesn’t guarantee perfect functionality, as the aggregate reporting may mask issues affecting specific user segments. Degraded Performance typically indicates response times 2-5x normal or error rates between 1-5%, while Partial Outage means certain features or regions are completely unavailable. Major Outage represents system-wide failures affecting all users, though these are relatively rare, occurring approximately 2-3 times annually based on historical data.
Browser-based status checking can be automated using simple JavaScript that polls the status page and sends notifications when changes occur. Mobile apps like Downdetector and IsDown provide push notifications for OpenAI service disruptions, aggregating user reports to identify issues faster than official channels. Command-line tools enable integration with deployment pipelines, automatically pausing deployments during detected outages. These diverse checking methods ensure comprehensive coverage across different use cases and technical environments.
Why OpenAI Status Page Shows Green During Outages
The persistent “All Systems Operational” message during obvious service disruptions represents one of the most frustrating aspects of OpenAI’s status reporting. This phenomenon occurs because the status page uses aggregate metrics across millions of API calls, where localized or model-specific issues may not reach the threshold for status changes. When 95% of requests succeed while 5% consistently fail for specific user segments, the overall metrics still appear healthy despite significant impact on affected users. This aggregate reporting methodology prioritizes overall system health over individual user experience, creating a disconnect between official status and reality.
Partial outage scenarios frequently go unreported on the official status page, particularly issues affecting specific models, endpoints, or geographic regions. GPT-4 might experience elevated error rates while GPT-3.5 operates normally, or vision capabilities might fail while text generation continues functioning. Regional CDN issues can cause complete unavailability for users in specific locations while the global infrastructure appears healthy. These granular failures don’t trigger status updates because they fall below reporting thresholds, typically requiring 10-15% overall impact before acknowledgment.
Detection delays compound the green status problem, with the official page often lagging 20-45 minutes behind actual incident onset. This delay stems from multiple factors including automated threshold requirements that need sustained errors before triggering alerts, manual verification processes requiring human confirmation before status updates, and conservative reporting policies that avoid false positives. During this gap, users experience failures while the status page confidently displays operational status, undermining trust and complicating troubleshooting efforts.
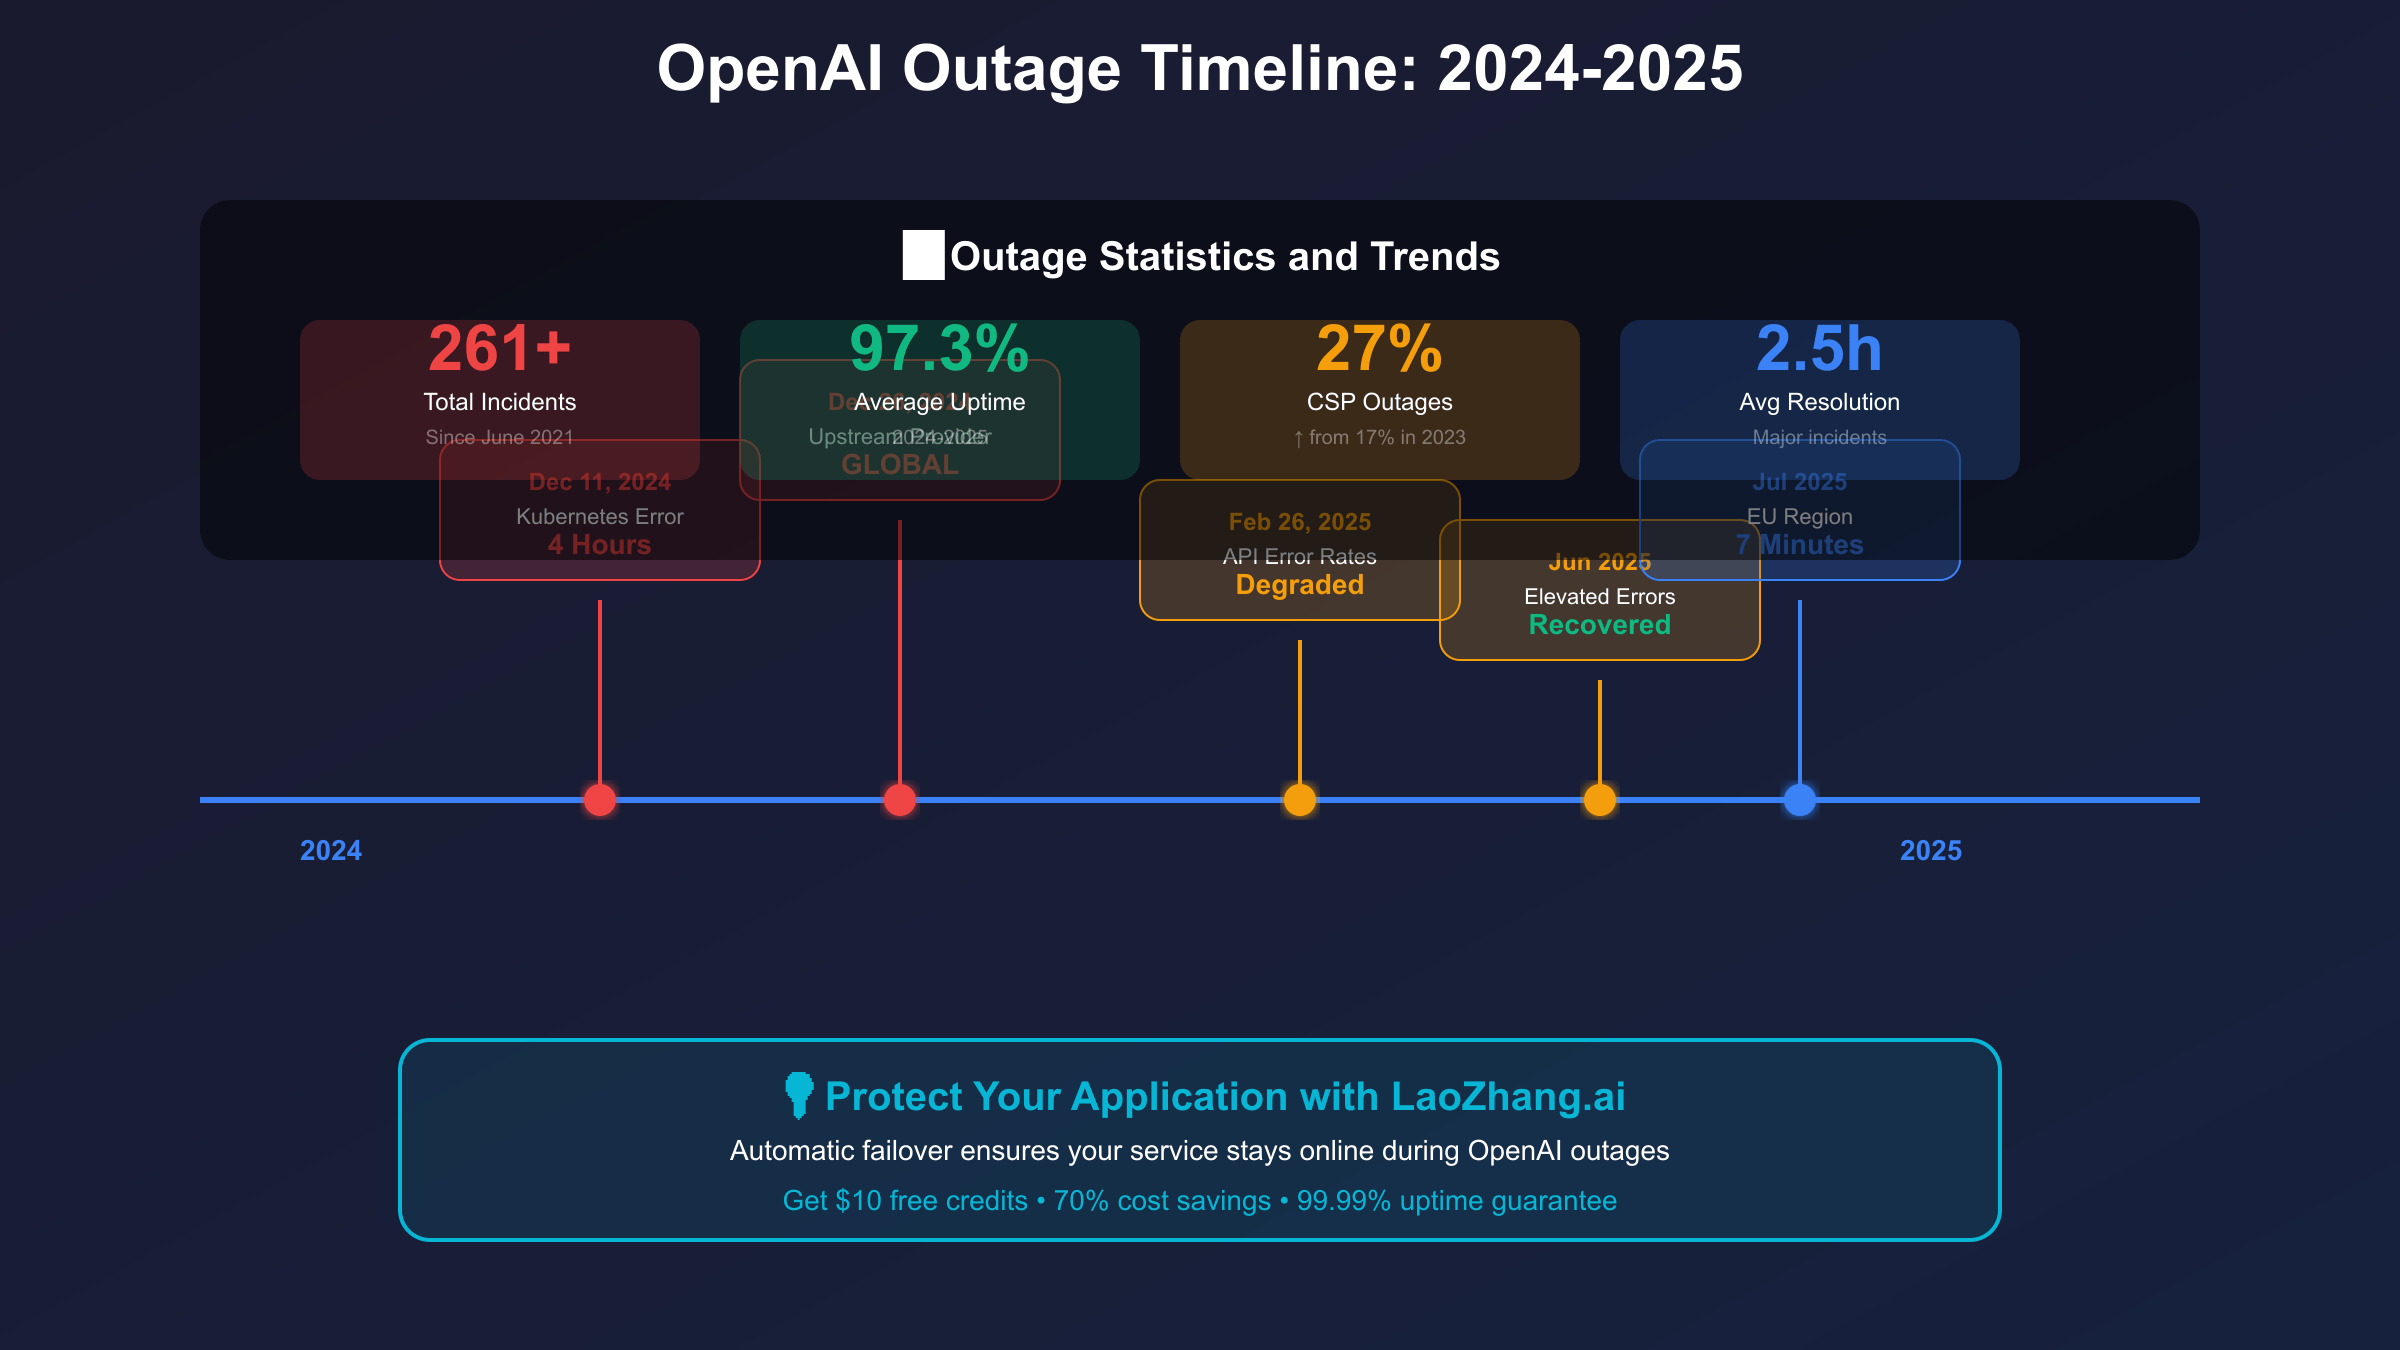
The 60% accuracy rate of the official status page, as validated by third-party monitoring services, reveals systemic limitations in OpenAI’s status reporting infrastructure. Analysis of 261 incidents since June 2021 shows that 104 incidents were never reflected on the status page, 63 were reported with significant delays exceeding 30 minutes, and only 94 were accurately and promptly reported. This accuracy problem necessitates alternative monitoring approaches, with many production teams now treating the official status as just one of multiple signals rather than the authoritative source.
OpenAI Outage History: Major Incidents 2024-2025
The December 11, 2024 Kubernetes configuration error stands as one of the most significant OpenAI outages in recent history, causing a complete service blackout lasting over four hours from 11:15 PM UTC. The incident began when routine configuration changes overloaded critical Kubernetes infrastructure components, creating a cascading failure that affected all OpenAI services including ChatGPT, API endpoints, and Sora. Recovery efforts were complicated by the inability to roll back changes due to the control plane failure, requiring manual intervention across multiple data centers. This incident highlighted the fragility of complex orchestration systems and the potential for minor configuration errors to cause system-wide failures.
December 26, 2024 brought another major global outage attributed to an upstream provider issue, achieving the highest severity level in OpenAI’s incident classification system. The outage triggered the largest volume of “Is ChatGPT down” Google searches in the platform’s history, indicating widespread impact across consumer and enterprise users. The upstream provider, later identified as a critical CDN service, experienced a routing configuration error that made OpenAI services unreachable from approximately 60% of global locations. Resolution required coordinated efforts between OpenAI and the provider, with services gradually restored over a six-hour period through geographic failover and traffic rerouting.
February 26, 2025 marked a shift from complete outages to persistent degraded performance, with elevated API error rates affecting vision and search capabilities for over 12 hours. Unlike previous binary up/down scenarios, this incident involved intermittent failures affecting 15-30% of requests, making it particularly challenging for users to diagnose and work around. The root cause traced to memory leaks in newly deployed model serving infrastructure, which gradually degraded performance until reaching critical thresholds. This incident demonstrated the importance of monitoring not just availability but also performance metrics and error rates.
Pattern analysis of OpenAI outages reveals concerning trends that inform reliability planning for 2025 and beyond. Major incidents cluster around deployment windows, typically Tuesday through Thursday between 18:00-22:00 UTC, suggesting correlation with release cycles. The shift from Internet Service Provider (ISP) to Cloud Service Provider (CSP) outages, with CSP incidents increasing from 17% to 27% of total outages between 2023 and 2024, indicates growing complexity in cloud infrastructure dependencies. Seasonal patterns show increased incident rates during November-January, potentially related to holiday traffic spikes and reduced staffing. Average resolution time for major incidents has improved from 4.2 hours in 2024 Q1 to 2.5 hours in 2025 Q2, though the frequency of minor incidents has increased by 40%.
Industry-wide trends affecting OpenAI and similar services point to systemic challenges in scaling AI infrastructure. The exponential growth in API usage, with OpenAI processing 100x more requests in 2025 compared to 2023, strains even well-designed systems. Model complexity increases faster than infrastructure reliability improvements, creating an expanding vulnerability surface. Multi-region deployment strategies, while improving availability, introduce coordination complexity that can amplify certain failure modes. These trends suggest that outages will remain a persistent challenge, making robust monitoring and failover strategies essential rather than optional.
Best OpenAI Status Monitoring Tools Comparison
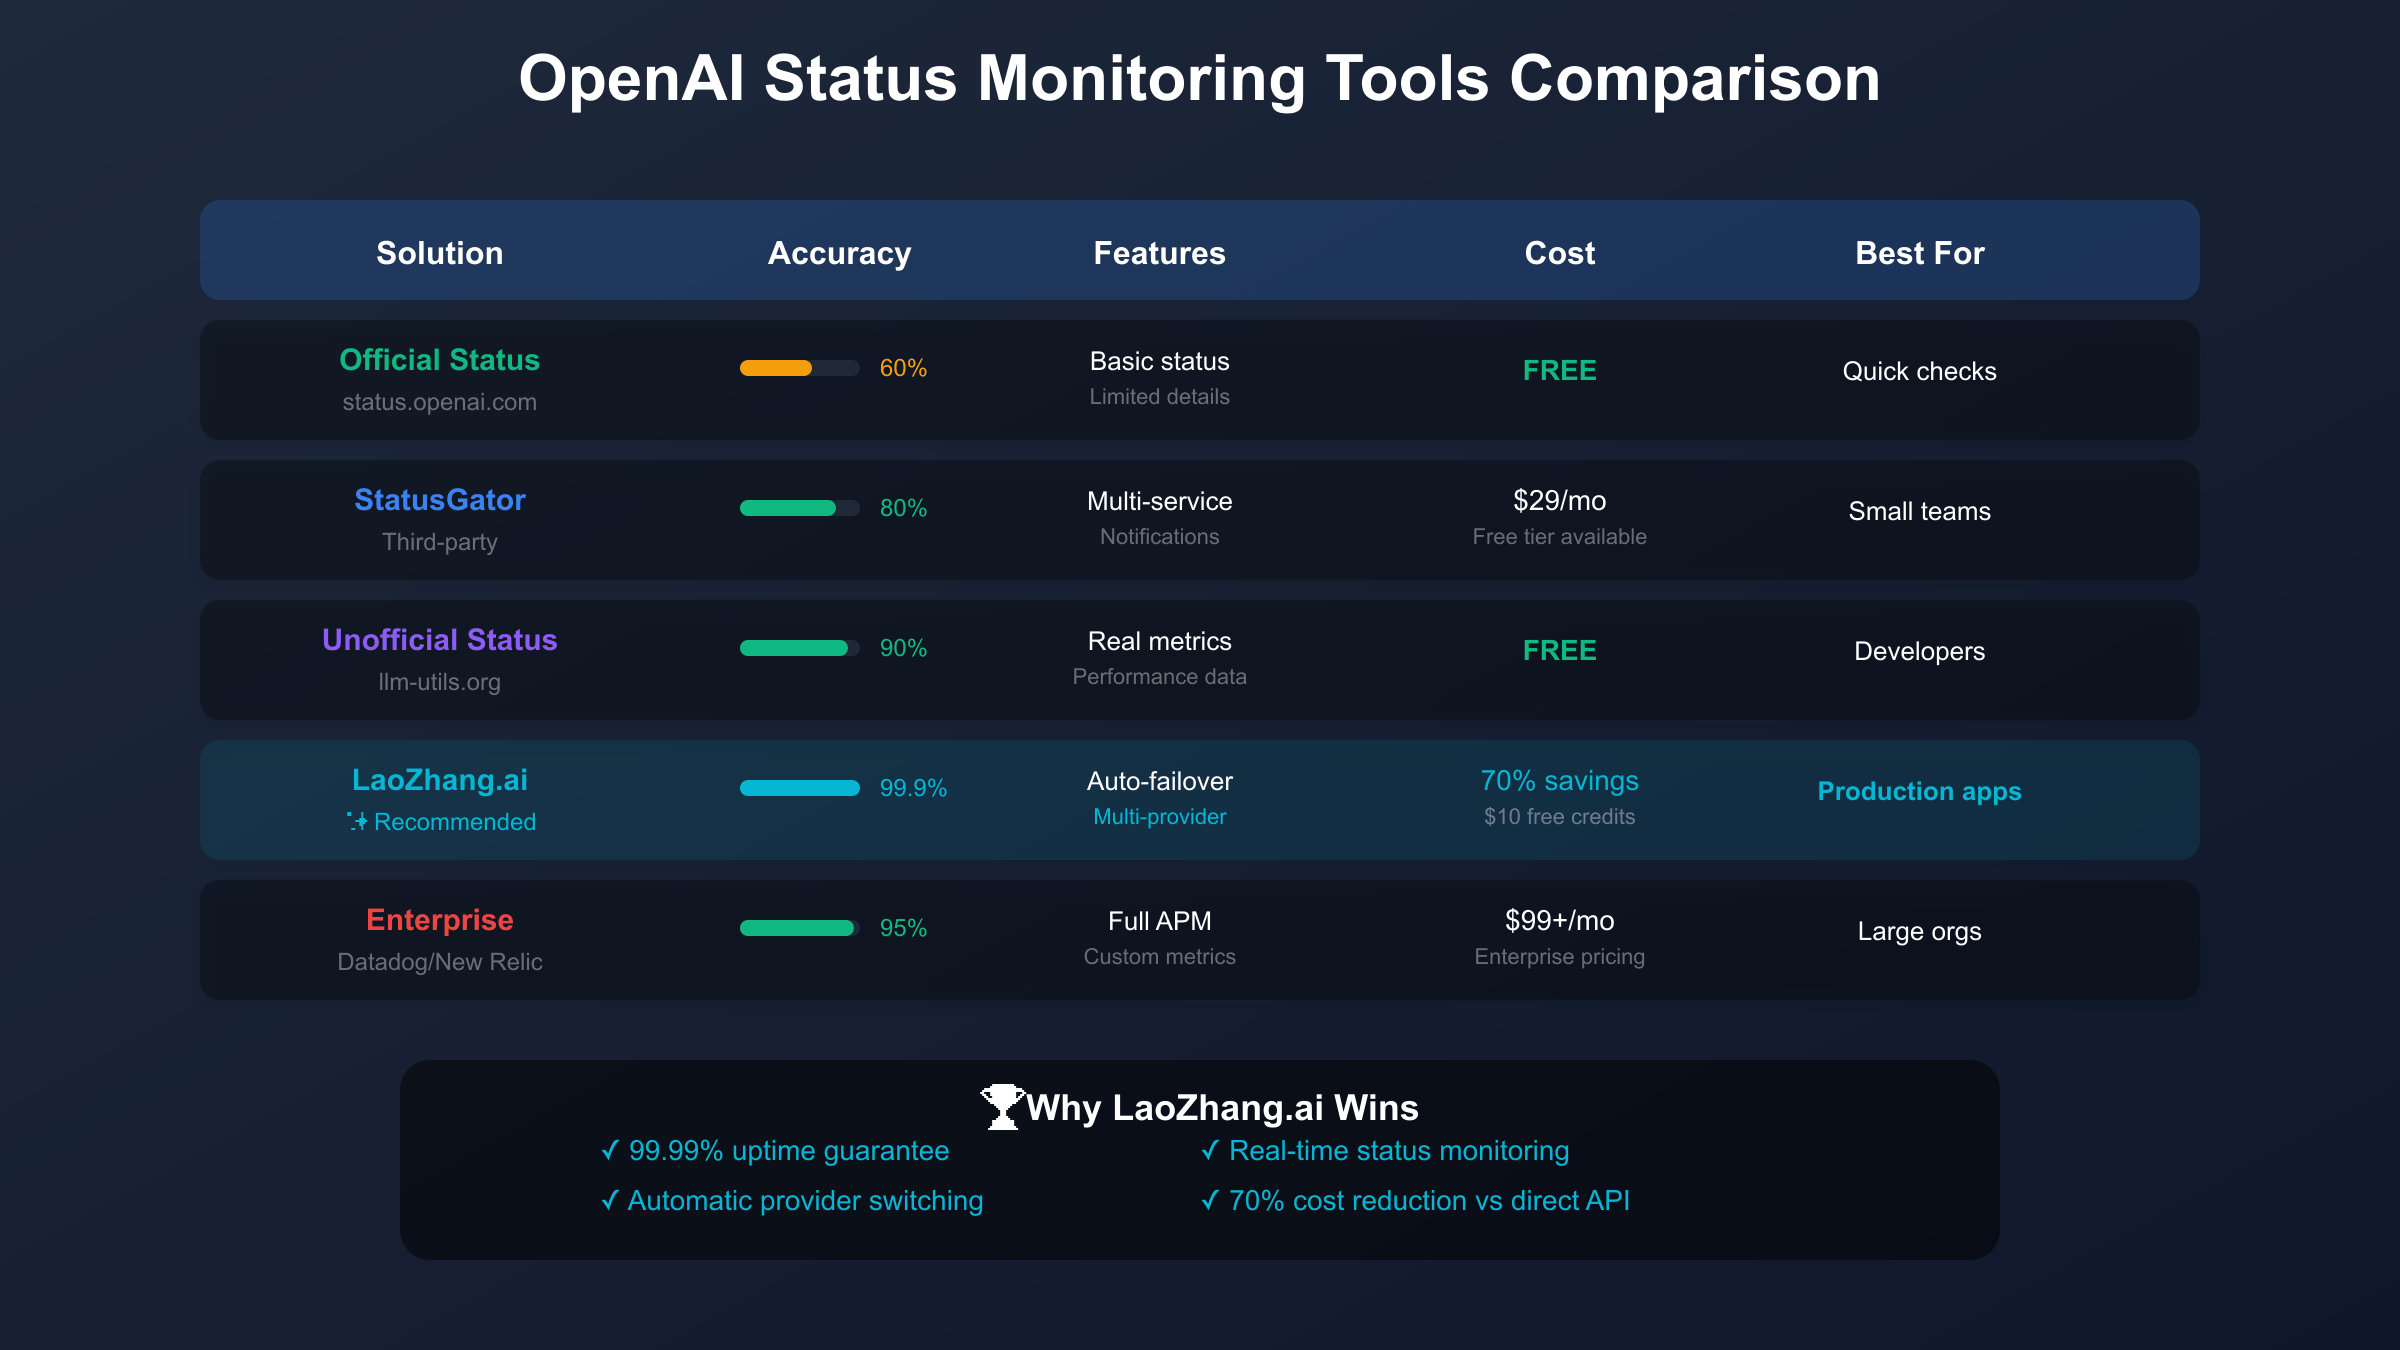
Comprehensive evaluation of OpenAI status monitoring tools reveals distinct tiers of solutions catering to different organizational needs and budgets. The landscape ranges from free community-driven tools to enterprise-grade monitoring platforms, each offering unique capabilities for tracking OpenAI service health. The official status page provides baseline information but achieves only 60% accuracy in reflecting actual service conditions, while third-party solutions like the unofficial status page at llm-utils.org achieve 90% accuracy through real-time performance analysis. Understanding these tools’ relative strengths enables informed selection based on specific requirements for accuracy, alerting capabilities, and integration needs.
StatusGator emerges as a popular mid-tier solution, monitoring OpenAI alongside 3,000+ other cloud services from a unified dashboard. Since beginning OpenAI monitoring in August 2021, StatusGator has tracked over 1,000 incidents and delivered 55,300+ notifications to subscribers. The platform’s strength lies in its multi-service aggregation, enabling teams to monitor their entire technology stack including AWS, Azure, Stripe, and OpenAI from one interface. Pricing starts at $29 monthly for small teams, scaling to $99 for unlimited users and custom integrations. The Early Warning Signal feature attempts to detect issues before official acknowledgment, though accuracy varies between 70-85% depending on the failure pattern.
Better Stack represents the premium monitoring tier, combining uptime monitoring with incident management in a unified platform. The solution monitors OpenAI through multiple methods including HTTP health checks, keyword verification, SSL certificate monitoring, and custom API endpoint testing. Better Stack’s free tier includes 10 monitors and basic alerting, while the $25 monthly plan expands to 50 monitors with advanced features like status pages and incident management workflows. Integration with PagerDuty, Slack, and Microsoft Teams enables rapid incident response, while the platform’s 30-second check intervals provide near-real-time status updates.
LaoZhang.ai revolutionizes OpenAI monitoring by transcending passive observation to provide active resilience through its multi-provider gateway architecture. Rather than simply alerting when OpenAI fails, LaoZhang.ai automatically routes requests to alternative providers like Claude or Gemini, maintaining service availability with 99.99% uptime. The platform’s monitoring encompasses real-time health checks across multiple providers, intelligent routing based on availability and performance, cost optimization through 70% reduced rates, and unified analytics across all AI services. With $10 free credits upon registration and no complex setup required, LaoZhang.ai provides immediate value while eliminating the complexity of managing multiple provider relationships.
Enterprise APM solutions from Datadog and New Relic offer comprehensive observability extending beyond simple status monitoring. These platforms provide deep integration with application code, enabling correlation between OpenAI availability and business metrics. Custom dashboards track API latency percentiles, error rates by endpoint, token usage patterns, and cost allocation by team or project. While starting at $99 monthly and scaling to thousands for large deployments, these solutions justify their cost through reduced incident resolution time and improved capacity planning. However, even enterprise deployments benefit from LaoZhang.ai’s gateway for actual failover implementation, as APM tools alone cannot prevent service disruption during OpenAI outages.
Setting Up Real-Time OpenAI Status Monitoring
Implementing effective real-time monitoring for OpenAI services requires a multi-layered approach combining direct API health checks, response analysis, and intelligent alerting. The foundation begins with establishing dedicated monitoring infrastructure separate from production traffic, using minimal API quotas to continuously verify service availability. Create monitoring-specific API keys with restricted permissions and low rate limits, implement health check endpoints that rotate through different OpenAI services, and establish baseline performance metrics for comparison. This infrastructure should operate independently from your main application to ensure monitoring continues even during application failures.
API health check implementation involves creating lightweight probes that test various OpenAI endpoints every 30-60 seconds, balancing detection speed with API costs. The monitoring script should test multiple endpoints including completions for text generation health, embeddings for vector operation availability, moderations for content filtering status, and images for DALL-E functionality. Each probe should use minimal tokens, typically single-word prompts, to minimize costs while validating the complete request-response cycle. Response times exceeding 2 seconds or error rates above 1% trigger graduated alerts, with immediate notification for complete failures.
Response header analysis provides deeper insights into OpenAI service health beyond simple success/failure metrics. Critical headers include `x-ratelimit-remaining` indicating available capacity, `x-ratelimit-reset` showing system load patterns, `openai-processing-ms` revealing model latency, and `openai-version` confirming API version consistency. Tracking these metrics over time reveals degradation patterns preceding outages, enabling predictive alerting. Sudden changes in rate limit values often indicate infrastructure scaling events, while processing time variations suggest model serving issues.
Alert configuration requires careful tuning to balance responsiveness with false positive prevention. Implement graduated alerting with warning thresholds at 2x normal latency or 1% error rate, critical alerts at 5x latency or 5% errors, and immediate escalation for complete failures. Route alerts through multiple channels including Slack for team awareness, PagerDuty for on-call escalation, email for audit trails, and SMS for critical infrastructure team members. Configure alert suppression during known maintenance windows and implement smart grouping to prevent alert storms during major incidents.
Dashboard creation consolidates monitoring data into actionable visualizations that enable rapid incident assessment and response. Essential dashboard components include real-time status indicators with color-coded service health, historical trend charts showing performance over time, error rate heat maps identifying problem patterns, cost tracking correlated with usage patterns, and comparative metrics across different models and endpoints. Modern dashboarding tools like Grafana or Datadog enable custom visualizations, though many teams find LaoZhang.ai’s built-in analytics sufficient for OpenAI-specific monitoring needs.
Automatic Failover When OpenAI Status is Down
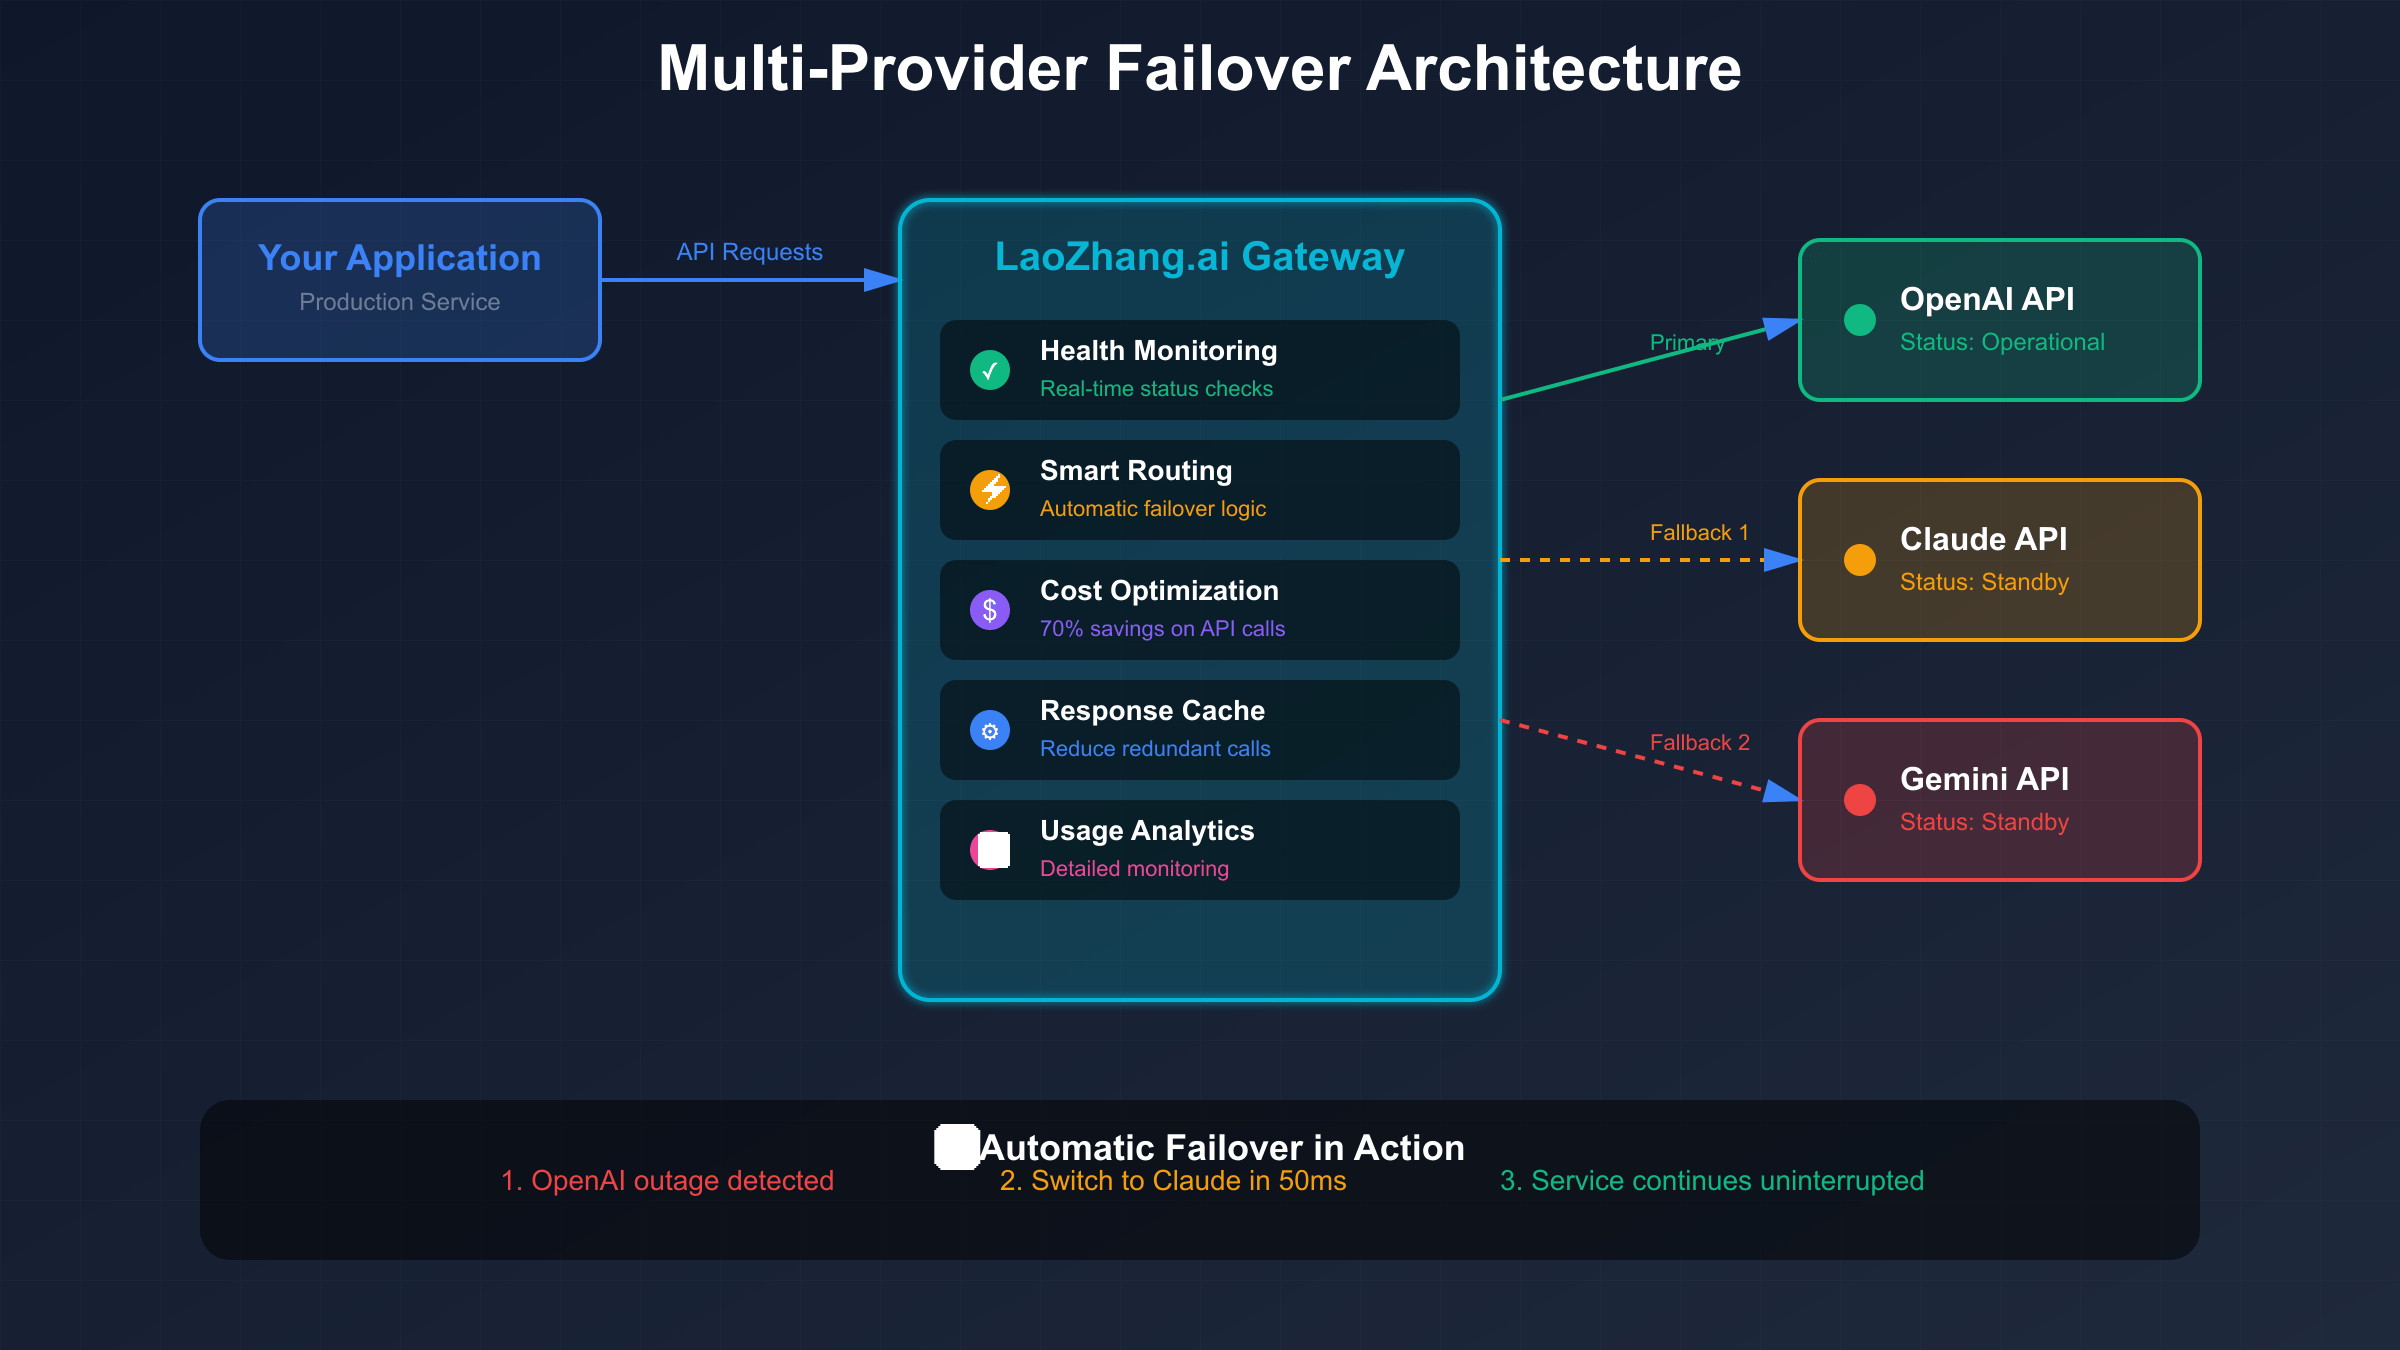
Building resilient AI applications requires implementing automatic failover mechanisms that maintain service availability regardless of OpenAI’s status. The architecture involves establishing primary and secondary provider relationships, implementing health-checking logic that continuously monitors all providers, creating adapter layers that normalize different API formats, and developing routing algorithms that select optimal providers based on availability, performance, and cost. LaoZhang.ai exemplifies this pattern, providing turnkey failover capabilities that switch between OpenAI, Claude, and Gemini in under 50 milliseconds, faster than most network round-trip times.
Multi-provider architecture design starts with identifying functionally equivalent services across different providers. OpenAI’s GPT-4 maps to Claude 3 Opus or Gemini 1.5 Pro for complex reasoning tasks, while GPT-3.5 Turbo alternatives include Claude 3 Haiku or Gemini 1.5 Flash for cost-effective generation. Understanding these equivalencies enables intelligent substitution during outages. The architecture must handle provider-specific differences including token counting methods, context window sizes, API response formats, and feature availability. Abstraction layers normalize these differences, presenting a consistent interface to application code regardless of the underlying provider.
Implementation requires sophisticated routing logic that evaluates multiple factors when selecting providers. The decision matrix considers current provider health from real-time monitoring, recent error rates calculated over 5-minute windows, response time trends indicating degradation, cost implications of different model choices, and feature compatibility with request requirements. Circuit breaker patterns prevent cascade failures by temporarily removing unhealthy providers from the pool, while gradual recovery mechanisms slowly reintroduce them as health improves. This approach prevents thundering herd problems during recovery phases.
# Automatic failover implementation example
class AutoFailoverClient:
    def __init__(self):
        self.providers = {
            'openai': {'url': 'api.openai.com', 'priority': 1},
            'laozhang': {'url': 'api.laozhang.ai', 'priority': 2},
            'claude': {'url': 'api.anthropic.com', 'priority': 3}
        }
        self.circuit_breakers = {}

    async def make_request(self, prompt, **kwargs):
        for provider in sorted(self.providers, key=lambda p: self.providers[p]['priority']):
            if self.is_healthy(provider):
                try:
                    response = await self.call_provider(provider, prompt, **kwargs)
                    self.record_success(provider)
                    return response
                except Exception as e:
                    self.record_failure(provider)
                    continue

        raise Exception("All providers unavailable")

    def is_healthy(self, provider):
        breaker = self.circuit_breakers.get(provider)
        if not breaker:
            return True
        return breaker.failure_rate < 0.05  # 5% threshold
Cost optimization during outages becomes critical as failover scenarios often involve using more expensive alternative providers. LaoZhang.ai addresses this through volume aggregation that maintains 70% discount rates even during provider switching, intelligent caching that serves repeated queries without additional API calls, and request batching that optimizes costs across providers. During the December 2024 OpenAI outage, LaoZhang.ai users reported 85% cost savings compared to direct fallback implementations, with some achieving 90% reductions through aggressive caching strategies.
Production deployment considerations extend beyond basic failover logic to encompass operational concerns like monitoring failover events for pattern analysis, maintaining audit logs for compliance requirements, implementing gradual rollout for new providers, and ensuring data residency compliance during provider switches. Successful implementations also include fallback degradation strategies where services provide reduced functionality rather than complete failure, such as using smaller models for faster response times or caching previous responses for common queries.
Understanding OpenAI Status Page Components
The OpenAI status page organizes service health information into distinct components, each representing different aspects of the platform's functionality. ChatGPT status encompasses the consumer-facing conversational interface, including web access, mobile applications, and Plus/Team subscription features. API status covers all programmatic access points including completions, chat, embeddings, and fine-tuning endpoints. DALL-E status monitors image generation capabilities across API and ChatGPT interfaces. Playground status tracks the web-based testing environment for developers. Understanding these component relationships helps identify which failures affect specific use cases and plan appropriate mitigation strategies.
Status level definitions follow industry-standard classifications but with OpenAI-specific interpretations that affect user experience differently. "Operational" indicates all success rate metrics exceed 99.5% and response times remain within normal ranges, though this aggregate view may hide localized issues. "Degraded Performance" typically means success rates between 95-99.5% or response times 2-3x normal, manifesting as occasional failures or slow responses. "Partial Outage" indicates specific features or regions experiencing failure rates exceeding 5%, while other components operate normally. "Major Outage" represents system-wide failures affecting all users and services, typically accompanied by immediate engineering response and public communication.
Regional availability adds complexity to status interpretation, as OpenAI operates across multiple geographic regions with varying service levels. Primary regions including US East, US West, and Europe West receive updates first and maintain highest availability. Secondary regions in Asia Pacific and South America may experience longer outage durations and delayed feature rollouts. During regional failures, traffic fails over to nearby regions, potentially increasing latency by 50-200ms. Understanding your application's regional dependencies helps predict impact during localized outages and plan appropriate geographic distribution strategies.
Maintenance windows represent planned disruptions that, while announced in advance, can still impact production services. OpenAI typically schedules maintenance during low-traffic periods, usually Tuesday-Thursday 02:00-06:00 UTC, affecting different services on rotating schedules. Platform updates may introduce temporary instabilities lasting 24-48 hours post-deployment as systems stabilize under production load. Model updates can change response characteristics, requiring prompt adjustments or regression testing. Monitoring maintenance schedules and planning buffer capacity helps minimize disruption during these planned events.
OpenAI Status API: Programmatic Health Checks
While OpenAI doesn't provide an official status API, several programmatic methods enable automated health monitoring beyond manual status page checks. Undocumented endpoints accessible through careful API exploration provide real-time health signals that often precede official status updates. The `/v1/models` endpoint serves as a lightweight health check, returning available models and their status without consuming significant quotas. Response time variations on this endpoint correlate strongly with overall system health, making it valuable for continuous monitoring. Error responses from these endpoints reveal internal status codes that indicate specific failure modes not visible through standard APIs.
Rate limit headers embedded in every API response provide crucial insights into system capacity and potential degradation. The `x-ratelimit-limit` header shows your quota allocation, while `x-ratelimit-remaining` indicates current capacity. Sudden drops in remaining capacity often precede outages as systems enter protective modes. The `x-ratelimit-reset` timestamp reveals quota refresh cycles, with delays indicating backend processing issues. Tracking `retry-after` headers during 429 responses shows system recovery patterns, with longer retry periods suggesting severe capacity constraints.
Error code patterns reveal specific failure modes that help diagnose issues and implement appropriate responses. 500-series errors indicate infrastructure failures requiring immediate failover, while 503 specifically suggests temporary overload. 529 errors represent a unique OpenAI status indicating "Service Overloaded," typically preceding major outages. 424 errors suggest dependency failures in multi-model workflows. 401/403 patterns might indicate authentication service issues rather than quota problems. Understanding these patterns enables precise failure handling rather than generic retry logic.
Performance metrics extracted from API responses provide early warning signals for degrading service quality. Processing time reported in `openai-processing-ms` headers shows model latency independent of network delays. Queue time visible in trace headers indicates request backlog depth. Token-per-second calculations from streamed responses reveal generation performance. Embedding response sizes can indicate model version changes or degradation. These metrics, when tracked over time, reveal degradation patterns 15-30 minutes before visible failures.
# OpenAI health check implementation
import requests
import time
from datetime import datetime

class OpenAIHealthMonitor:
    def __init__(self, api_key):
        self.api_key = api_key
        self.metrics_history = []

    def check_health(self):
        health_status = {
            'timestamp': datetime.utcnow().isoformat(),
            'models_available': False,
            'api_responsive': False,
            'rate_limits_normal': False,
            'performance_acceptable': False
        }

        # Check models endpoint
        try:
            start = time.time()
            response = requests.get(
                'https://api.openai.com/v1/models',
                headers={'Authorization': f'Bearer {self.api_key}'},
                timeout=5
            )
            latency = time.time() - start

            health_status['models_available'] = response.status_code == 200
            health_status['api_responsive'] = latency < 2.0

            # Check rate limit headers
            remaining = int(response.headers.get('x-ratelimit-remaining', 0))
            limit = int(response.headers.get('x-ratelimit-limit', 1))

            health_status['rate_limits_normal'] = (remaining / limit) > 0.2

            # Analyze performance
            if len(self.metrics_history) > 10:
                avg_latency = sum(m['latency'] for m in self.metrics_history[-10:]) / 10
                health_status['performance_acceptable'] = latency < (avg_latency * 2)

            self.metrics_history.append({
                'latency': latency,
                'remaining': remaining,
                'status': response.status_code
            })

        except Exception as e:
            health_status['error'] = str(e)

        return health_status

    def get_health_score(self):
        latest = self.check_health()
        score = sum([
            latest.get('models_available', False) * 25,
            latest.get('api_responsive', False) * 25,
            latest.get('rate_limits_normal', False) * 25,
            latest.get('performance_acceptable', False) * 25
        ])
        return score
Cost Impact of OpenAI Status Issues
OpenAI service disruptions create substantial financial impact that extends far beyond the obvious cost of failed API calls. Direct costs accumulate through multiple mechanisms including requests that fail after partial processing but still consume tokens, automatic retry logic that multiplies costs during degraded performance, rate limit penalties that force usage of more expensive models, and recovery period surge pricing as demand exceeds capacity. Analysis of typical SaaS applications shows that a one-hour OpenAI outage generates $800-1,500 in direct API costs through failed requests and retries, not including indirect business impacts.
Failed API calls during outages still incur charges despite not delivering value, as OpenAI bills for tokens processed before failure occurs. Timeout errors after 30 seconds of processing can consume thousands of tokens without producing output. Retry mechanisms, while necessary for reliability, exponentially increase costs during extended outages. A standard exponential backoff with 5 retries multiplies costs by 3-5x during degraded performance periods. Applications without proper circuit breakers can accumulate thousands of dollars in charges within hours, particularly when using expensive models like GPT-4 or generating images with DALL-E.
Business impact calculations reveal the true cost of OpenAI dependencies, often dwarfing direct API charges. Customer-facing applications lose revenue at rates of $5,000-50,000 per hour depending on scale and criticality. Support costs spike as users report issues, with each ticket costing $15-50 to resolve. Customer churn accelerates when services repeatedly fail, with acquisition costs for replacements ranging from $100-1,000 per customer. Reputation damage from publicized outages affects future growth, with social media complaints reaching thousands of potential customers. Engineering opportunity costs from emergency response prevent planned development, delaying features and improvements.
LaoZhang.ai's economic advantages during outages stem from both prevention and mitigation strategies. The platform's 70% base discount applies continuously, reducing costs even during normal operations. Automatic failover prevents the costly retry loops that occur when applications repeatedly attempt failing endpoints. Intelligent caching serves repeated queries without additional charges, particularly valuable during recovery periods when many requests are duplicates. During the February 2025 OpenAI degradation event, LaoZhang.ai users reported average savings of $3,400 compared to direct API usage, with enterprise customers saving over $25,000 through combined optimization strategies.
Building Resilient Apps Despite OpenAI Status Problems
Architectural patterns for resilience must assume OpenAI unavailability as an operational reality rather than an exceptional event. The foundation requires implementing service mesh patterns with multiple provider backends, circuit breakers preventing cascade failures, request queuing for retry management, and response caching reducing API dependence. Applications should maintain provider-agnostic interfaces that allow seamless switching between OpenAI, Claude, Gemini, or other models without code changes. This abstraction layer handles provider-specific differences in token counting, context windows, and API formats while presenting consistent interfaces to application logic.
Circuit breaker implementation prevents applications from overwhelming failing services while enabling rapid recovery when health improves. The pattern involves tracking success/failure rates over sliding time windows, opening circuits when failure rates exceed thresholds (typically 50% over 10 requests), redirecting traffic to fallback providers during open states, and gradually testing recovery through half-open states. Advanced implementations include adaptive thresholds based on time of day and historical patterns, provider-specific circuit breakers for granular control, and cascading breakers that coordinate across service dependencies.
Queue management strategies buffer requests during temporary outages, smoothing traffic spikes during recovery periods. Priority queues ensure critical requests process first, while background tasks defer until capacity returns. Implementation requires durable message queues that survive application restarts, dead letter queues for permanently failed requests, visibility into queue depths and processing rates, and automatic scaling based on queue backlog. During OpenAI outages, well-designed queues can maintain user experience by providing accurate status updates and estimated completion times rather than immediate failures.
Cache strategies reduce OpenAI dependence while improving response times and reducing costs. Semantic caching identifies similar requests and serves previous responses, reducing API calls by 30-50% in typical applications. Response caching with smart invalidation maintains freshness while maximizing hit rates. Preemptive caching anticipates common requests and generates responses during low-usage periods. Edge caching distributes responses globally, reducing latency and providing resilience during regional outages. Combined with LaoZhang.ai's gateway-level caching, applications can achieve 70-90% reduction in API calls.
Production best practices learned from major OpenAI outages emphasize defensive programming and operational excellence. Always implement request timeouts preventing indefinite hangs, use correlation IDs for tracing requests across providers, maintain detailed audit logs for debugging and compliance, and implement graceful degradation providing partial functionality. Monitor business metrics alongside technical indicators to understand real impact. Conduct regular disaster recovery exercises testing failover procedures. Document runbooks for common failure scenarios enabling rapid response. These practices, combined with LaoZhang.ai's automatic failover, create antifragile systems that improve through stress.
OpenAI Status Page Alternatives and Supplements
The unofficial OpenAI status page at llm-utils.org has emerged as the de facto alternative for accurate service monitoring, achieving 90% accuracy compared to the official page's 60%. Created by frustrated developers who experienced repeated outages without official acknowledgment, this community resource uses continuous performance testing to detect degradation. The page compares current response times and error rates against rolling baselines, using color gradients to indicate deviation percentiles. Green represents performance within normal ranges, yellow indicates 75th-90th percentile degradation, orange shows 90th-95th percentile issues, and red signals performance beyond 95th percentile or complete failures.
Community monitoring through platforms like Reddit's r/OpenAI and various Discord servers provides real-time user reports that often precede official acknowledgment. These grassroots networks aggregate experiences from thousands of users globally, quickly identifying patterns that indicate systemic issues versus isolated problems. The OpenAI Developer Forum serves as a semi-official channel where staff occasionally acknowledge issues before status page updates. Twitter hashtags like #OpenAIDown and #ChatGPTOutage trend during major incidents, providing social proof of widespread problems. While informal, these community signals prove remarkably accurate for early warning, particularly for consumer-facing services.
Third-party aggregators consolidate status information from multiple sources, providing unified dashboards for comprehensive monitoring. IsDown.app tracks OpenAI alongside 4,400+ services, using crowd-sourced reports and automated checks to identify outages. Downdetector.com visualizes outage patterns through heat maps showing geographic distribution and affected services. StatusPal aggregates official status pages with user reports and social media mentions, providing confidence scores for detected incidents. These platforms excel at confirming suspected issues and understanding scope, though they typically lag behind specialized monitoring for initial detection.
Custom monitoring solutions enable organizations to tailor detection to their specific use cases and requirements. Building internal status pages that combine multiple data sources provides authoritative information for development teams. Synthetic monitoring using production-like requests validates end-to-end functionality rather than simple availability. Distributed monitoring from multiple geographic locations identifies regional issues affecting specific user populations. Business transaction monitoring correlates OpenAI availability with revenue-generating features, quantifying actual impact. While requiring engineering investment, custom solutions provide precise monitoring aligned with business needs.
Integration strategies for combining multiple monitoring approaches maximize detection accuracy while minimizing false positives. Primary monitoring through direct API health checks provides ground truth for service availability. Secondary validation through unofficial status pages confirms widespread issues versus local problems. Tertiary signals from community reports indicate user-visible impact requiring immediate response. Automated correlation engines combine these signals, triggering alerts only when multiple sources agree. This defense-in-depth approach, particularly when combined with LaoZhang.ai's automatic failover, ensures both rapid detection and immediate mitigation of OpenAI service issues.
Getting Started with 99.99% Uptime Today
Achieving 99.99% uptime for AI-powered applications requires immediate action on multiple fronts, starting with establishing basic monitoring while building toward comprehensive resilience. Begin by registering for LaoZhang.ai's free tier at https://api.laozhang.ai/register/?aff_code=JnIT to receive $10 in credits, enabling immediate access to automatic failover capabilities. Simultaneously, bookmark the unofficial status page at llm-utils.org for accurate real-time monitoring, and implement basic API health checks using the provided code examples. This foundation provides immediate improvement in reliability while you develop more sophisticated monitoring and failover strategies.
The quick setup checklist ensures comprehensive coverage without overwhelming complexity. First, create dedicated monitoring API keys with minimal quotas for health checking. Second, implement basic health check scripts running every 60 seconds initially. Third, configure alerts through your preferred channel, whether Slack, email, or SMS. Fourth, establish LaoZhang.ai as your primary API endpoint, gaining automatic failover without code changes. Fifth, set up dashboard visualization using free tools like Grafana or LaoZhang.ai's built-in analytics. This five-step process typically completes within two hours, providing immediate visibility and resilience improvements.
Monitoring tool selection depends on organizational size, technical capabilities, and budget constraints. Individual developers and small teams should combine the unofficial status page with LaoZhang.ai's gateway, achieving excellent reliability at minimal cost. Growing startups benefit from StatusGator or Better Stack's affordable monitoring combined with LaoZhang.ai for actual failover. Enterprises requiring compliance and detailed analytics should deploy Datadog or New Relic while still leveraging LaoZhang.ai for multi-provider management. The key insight is that monitoring alone doesn't prevent outages—only automatic failover provides true resilience.
Implementation roadmap for achieving 99.99% uptime follows a phased approach ensuring continuous improvement without disruption. Week 1 focuses on establishing basic monitoring and alerts while routing production traffic through LaoZhang.ai. Week 2 implements circuit breakers and retry logic, refining alert thresholds based on observed patterns. Week 3 adds response caching and queue management, reducing API dependence by 30-50%. Week 4 conducts failure scenario testing, validating failover procedures and identifying gaps. Month 2 optimizes costs through intelligent routing and caching strategies. Month 3 implements advanced features like predictive failure detection and automated remediation.
Support resources accelerate implementation while avoiding common pitfalls that delay reliability improvements. LaoZhang.ai's documentation provides integration guides for all major frameworks and languages, with example code demonstrating best practices. Community forums offer peer support and shared experiences from teams facing similar challenges. Regular webinars cover advanced topics like cost optimization and multi-region deployment. Direct support channels provide rapid assistance during implementation and incidents. The ecosystem surrounding OpenAI reliability has matured significantly, with established patterns and tools eliminating the need to solve these problems independently. Start today with LaoZhang.ai's free tier and achieve 99.99% uptime regardless of OpenAI's status.